. 2021 Oct 4;10:e74047. doi: 10.7554/eLife.74047

Figure 2. ER stress induces gstD-GFP expression in the eye imaginal disc.

(A) Schematic of the gstD-GFP reporter and the gstD locus, which encodes multiple gstD isozymes in close proximity to the 2.7 kb gstD1/gstD2 intergenic enhancer (scale is approximate). (B–C) Planar views of gstD-GFP larval eye discs also expressing either lacZ or Rh1G69D driven by GMR-Gal4. (B’, C’) show merged images of discs with gstD-GFP expression in green, and Rh1 or lacZ in red. (B, C) show only the green channel. Anterior is to the left and posterior to the right. Scale bar = 50 μm. (D) Quantification of gstD-GFP pixel intensity fold change from eye discs with the indicated genotypes. Statistical significance based on t test (two tailed). **** = p < 0.0001. (E, F) A magnified view of GMR > Rh1G69D eye discs in apico-basal orientation. gstD-GFP signals are marked in green. (E) Posterior eye disc double labeled with anti-Rh1 (red). (F) An equivalent region labeled with anti-Elav antibody that marks photoreceptors (magenta). Scale bar = 10 μm (G) A magnified view of GMR > Rh1G69D eye discs in planar orientation with gstD-GFP (green) and anti-Elav labeling (red). Individual channels are shown separately in (G’ – G’’’). Scale bar = 2.5 µm.

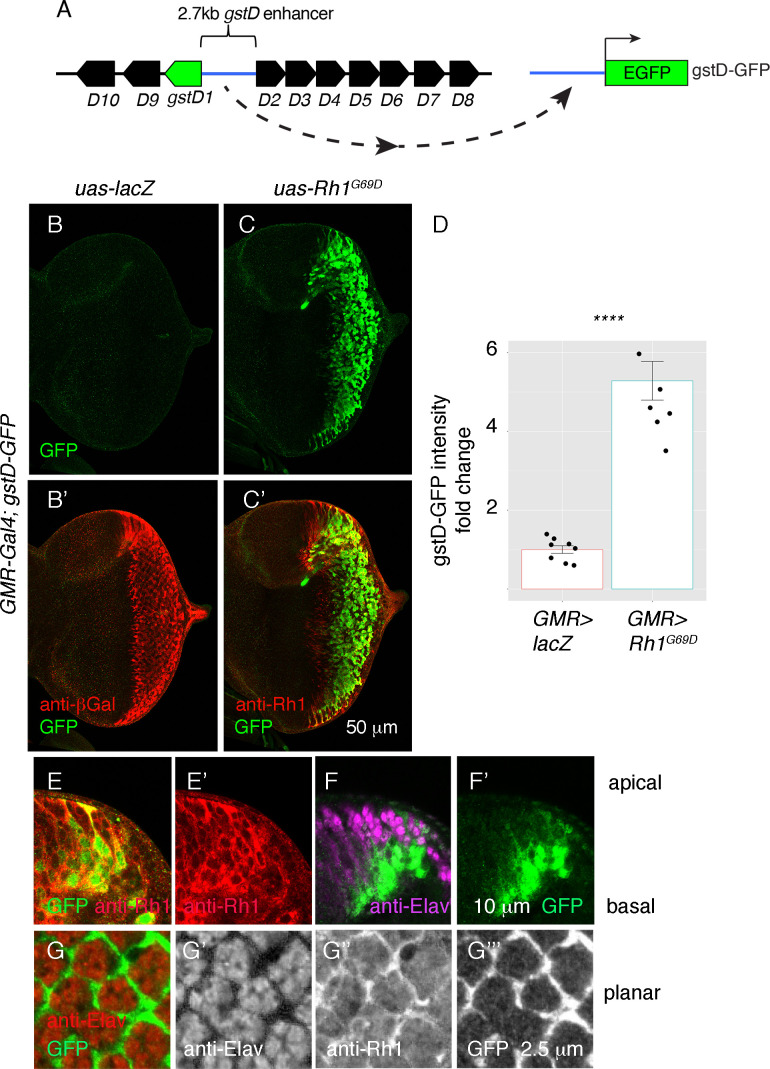
Figure 2.

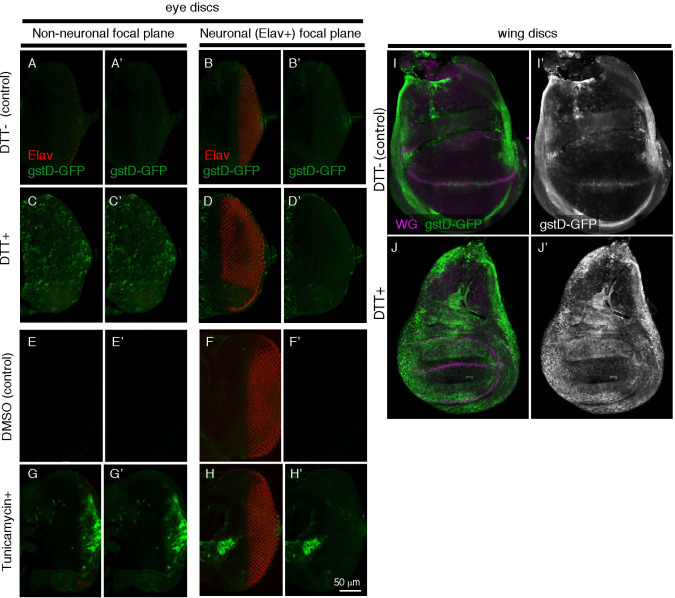
Figure 2—figure supplement 1. gstD-GFP induction by ER-stress causing chemicals.

Figure 2—figure supplement 1.

gstD-GFP transgenic larval imaginal discs, imaged for gstD-GFP (green). (A–D) Representative images of eye imaginal discs incubated in control culture media (A, B), or with that containing the ER-stress-causing chemical DTT (C, D). Anti-Elav (red) labeling shows photoreceptor nuclei. Shown are images of two different focal planes: (A, C) The support cell layer focal plane that does not include Elav-positive nuclei. (B, D) The Elav-positive focal plane. Note that gstD-GFP is induced primarily in the Elav-negative cell layer. (E, H) Eye discs incubated with tunicamycin dissolved in DMSO (G, H), or just with DMSO (E, F). Shown are two different focal planes, the Elav-negative (E, G) and Elav-positive cell layers (F, H). (I, J) Wing imaginal discs incubated with control culture media (I), or with media containing 2 mM DTT for 4 hr (J). Anti-Wg (magenta) was used for counterstaining. (A’, B’, C’, D’, E’, F’, G’, H’, I’, J’) gstD-GFP single channels. Scale bar in H’ = 50 μm.
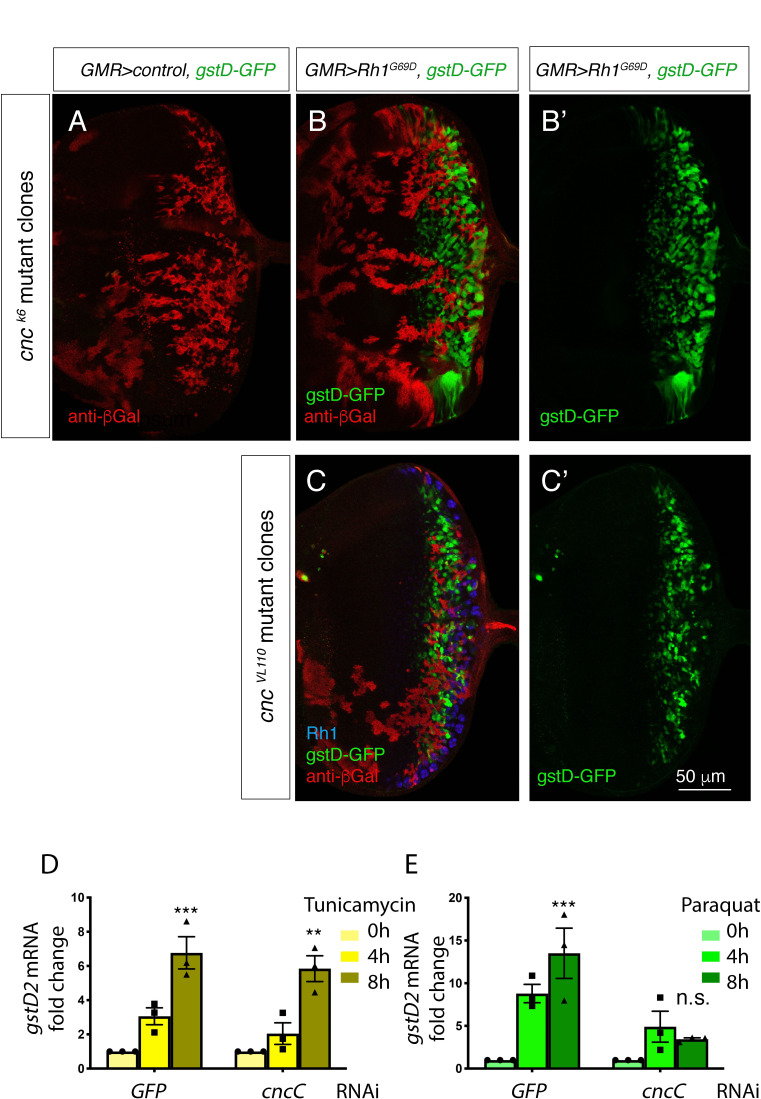
Figure 2—figure supplement 2. ER stress-induced expression of gstDs is independent of cncC.

Figure 2—figure supplement 2.

(A–C) Eye imaginal discs labeled with gstD-GFP (green). The cncC homozygous mosaic clones are marked by the absence of anti-βGal antibody labeling (red). (A) A control disc with cnck6 mutant clones but not overexpressing Rh1G69D. (B, C) GMR> Rh1G69D eye discs with cncC mutant clones. Note that gstD-GFP signal is present in cnck6 (B) nor cncvl100 homozygous mutant clones. In (C), blue shows anti-Rh1. (B’, C’) show gstD-GFP only channels of (B, C). (D, E) qRT-PCR of gstD2 normalized to Rpl15 in S2 cells where ER stress is induced by 10 μg/ml tunicamycin treatment (D) or 20 mM paraquat (E) for 0, 4, or 8 hr. Cells were treated with dsRNA against either GFP or cncC. Scale bar = 50 um. ** = p < 0.005, *** = p < 0.001.
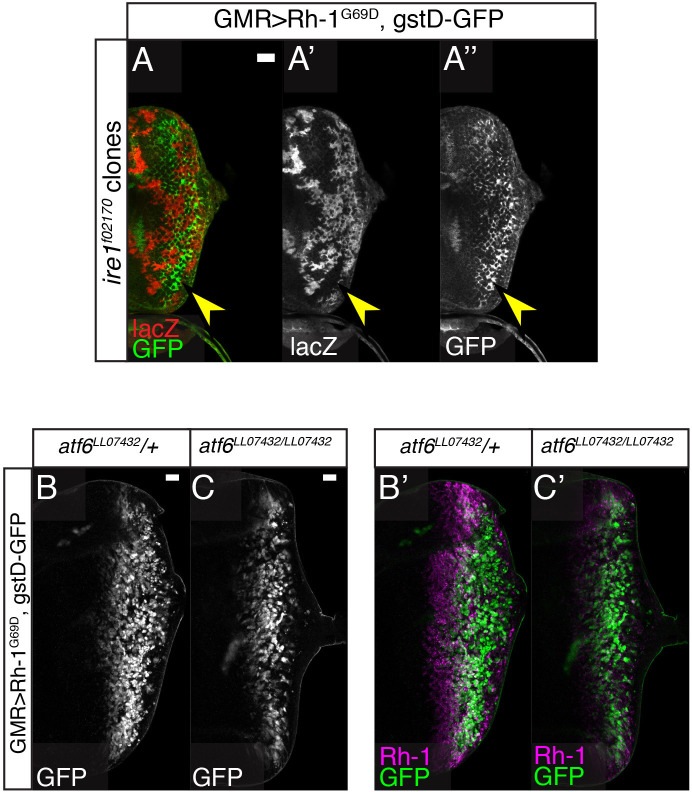
Figure 2—figure supplement 3. Rh1G69D -induced expression of gstD-GFP neither requires Ire1 nor Atf6.

Figure 2—figure supplement 3.

(A–C) GMR> Rh1G69D eye discs expressing gstD-GFP (green) in the indicated genetic backgrounds. (A) Ire1f02170 homozygous mutant clones marked by the absence of βGal expression (red). Note the presence of gstD-GFP expression within the mutant clones. Also shown are single channels of βGal (A’) and GFP (B’). (B, C) GMR> Rh1G69D eye discs in Atf6LL07432 heterozygous (B) and homozygous backgrounds (C). gstD-GFP single channels (B, C) and those merged with anti-Rh1 (magenta) (B’, C’). Neither GMR-Gal4> eIF2αWT (C), nor GMR-Gal4> eIF2α51D (D) activates this reporter.