
Fig. 3. Performance in Experiment 1.
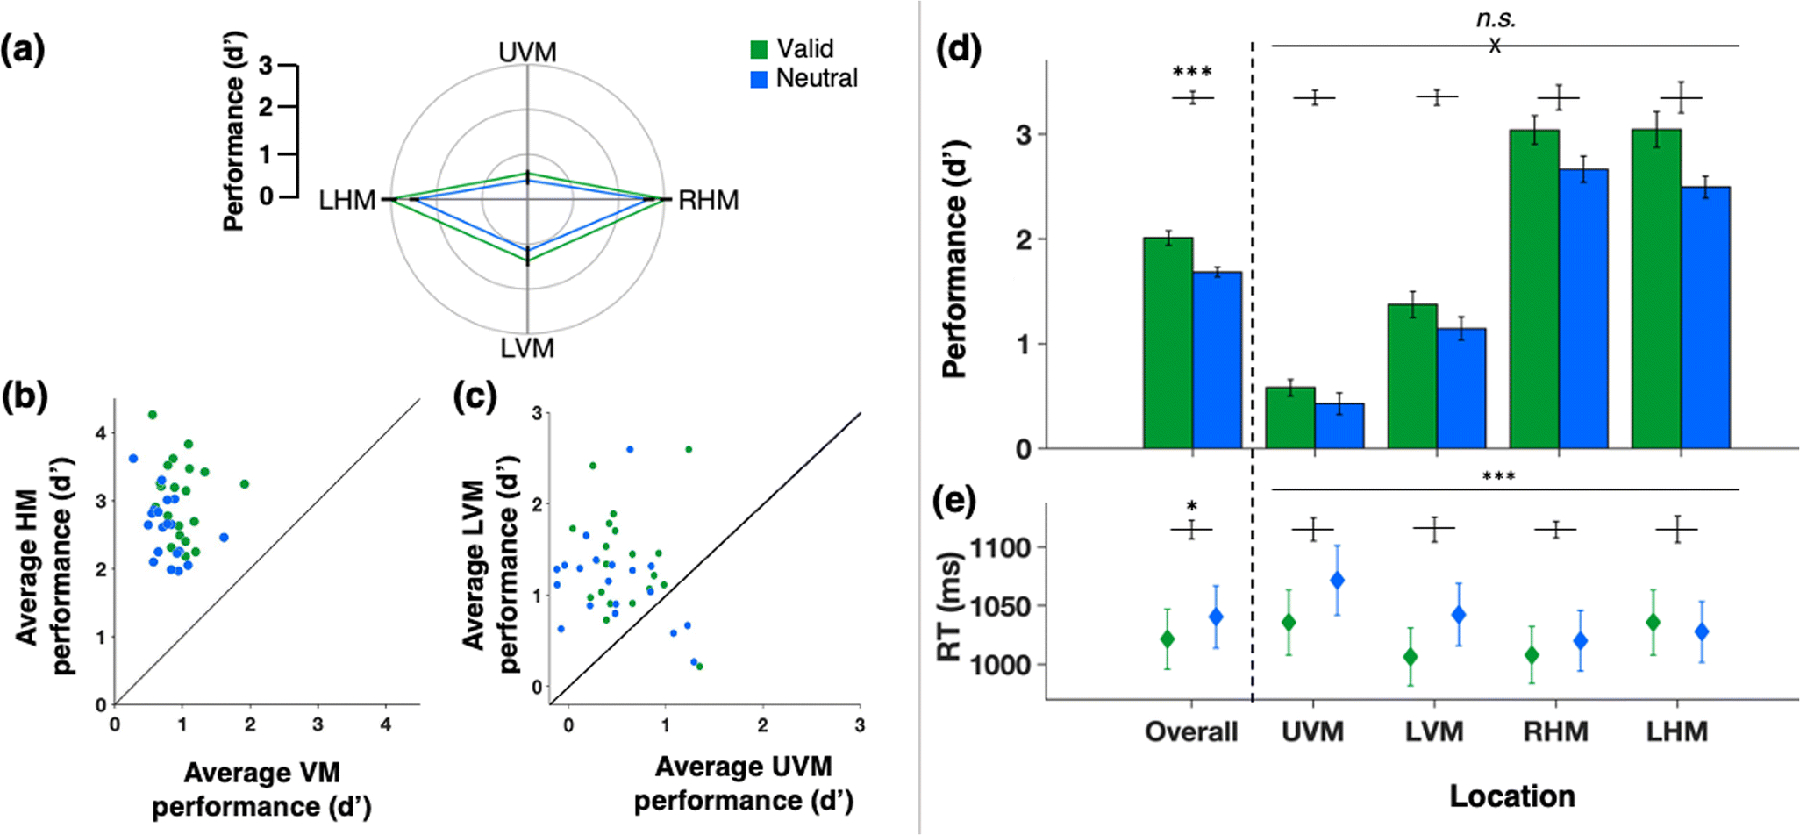
Green - valid cue condition trials, blue - neutral cue condition trials.
(a) Average d’ for each location (polar plot of performance field). (b) Scatterplot of individual d’ values of the horizontal-vertical anisotropy (HVA) (average d’ at horizontal meridian (HM) vs. average d’ at vertical meridian (VM)). (c) Scatterplot of individual d’ values of the vertical meridian asymmetry (VMA) (average d’ at lower vertical meridian (LVM) vs. average d’ at upper vertical meridian (UVM)). (d) Group average d’ (bar plots overall and by location). (e) Group average median reaction times (bar plots overall and by location). Error bars are ±1 SEM. n.s. = not significant; *p < .05; **p < .01; ***p < .001.