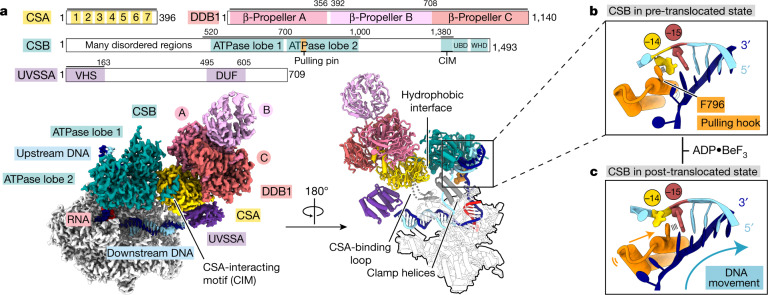
Fig. 1. Structure of the Pol II–TCR complex.
a, Cryo-EM density (left) and ribbon model (right) of the Pol II–CSB–CSA–DDB1–UVSSA complex. The scheme depicts the domain composition and colour code for proteins. The solid black lines mark residues included in the model. UBD, ubiquitin-binding domain; WHD, winged-helix domain; DUF, domain of unknown function. b, Zoom-in on the upstream DNA fork bound to the pulling hook of CSB in the pre-translocated state. c, Same as in b but in the post-translocated state.

