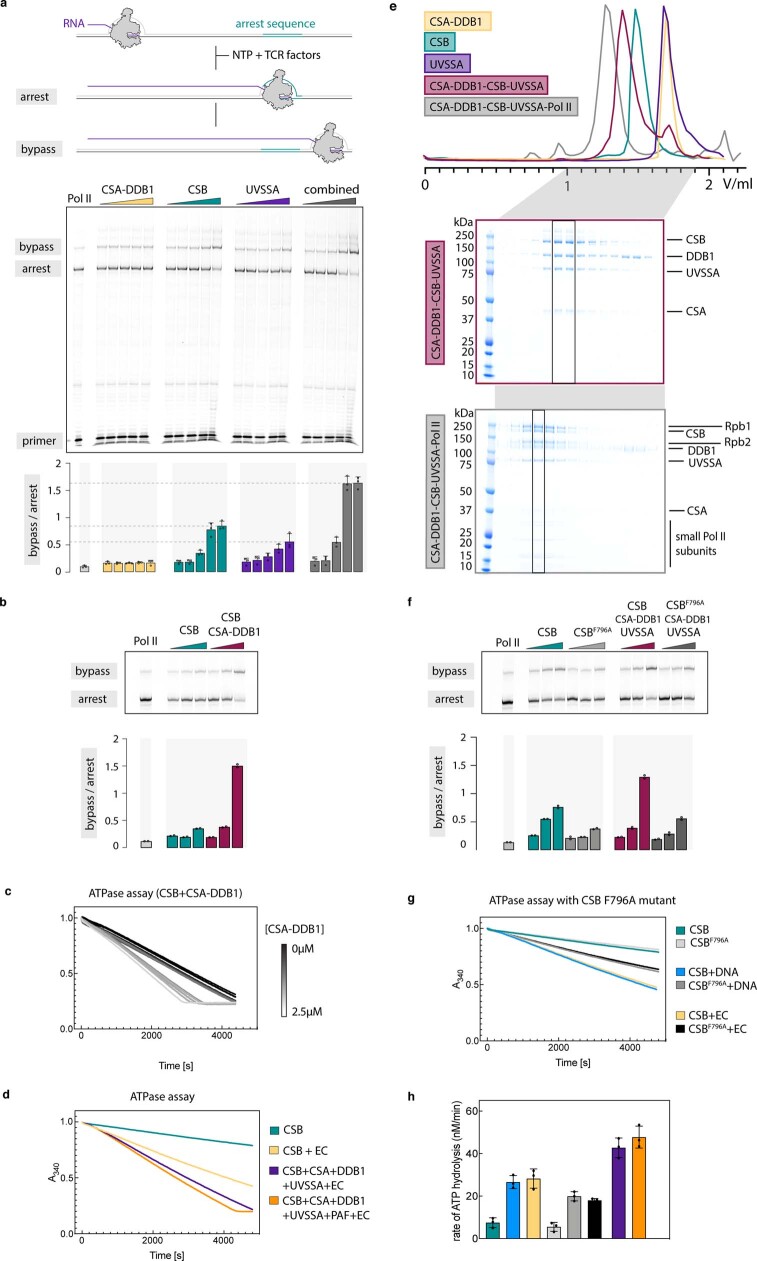
Extended Data Fig. 1. Biochemical characterisation of TCR factors.
a, In vitro transcription over an arrest sequence in the presence of TCR factors. The ratio of band intensity for bypass and arrest products was plotted for triplicate measurement. Data are presented as mean values ± SD. b, In vitro transcription over an arrest sequence in the presence of CSB or CSB-CSA-DDB1 complex. The experiment was repeated two times independently with similar results. Bar graph shows an average value for duplicate measurement. c, ATPase assay monitoring CSB activity in the presence of increasing amounts of CSA-DDB1. The experiment was repeated two times independently with similar results. d, ATPase assay monitoring stimulation of CSB activity in the presence of Pol II elongation complex, TCR factors and PAF. Analysis shown in h. e, Analytical size exclusion chromatography of CSA-DDB1, CSB, UVSSA, CSA-DDB1-CSB-UVSSA and Pol II-CSA-DDB1-CSB-UVSSA complexes. The two latter samples were analysed by SDS-PAGE, which confirmed complex composition and purity. The experiment was performed once for individual factors and at least three times for the complexes. f, In vitro transcription over an arrest sequence in the presence of CSB or CSB mutant F796A. The experiment was repeated two times independently with similar results. Bar graph shows an average value for duplicate measurement. g, ATPase assay monitoring the activity of CSB mutant F796A alone, in the presence of bubble DNA and in the presence of a Pol II elongation complex (EC). Analysis shown in h. h, Summary of ATPase assay results. The rate of ATP hydrolysis was plotted for triplicate measurement. The colour code as in panels d and g. Data are presented as mean values ± SD. For original gel scans and graph data associated with the Extended Data Fig. 1 see Supplementary Fig. 1 and Supplementary Table 1, respectively.

