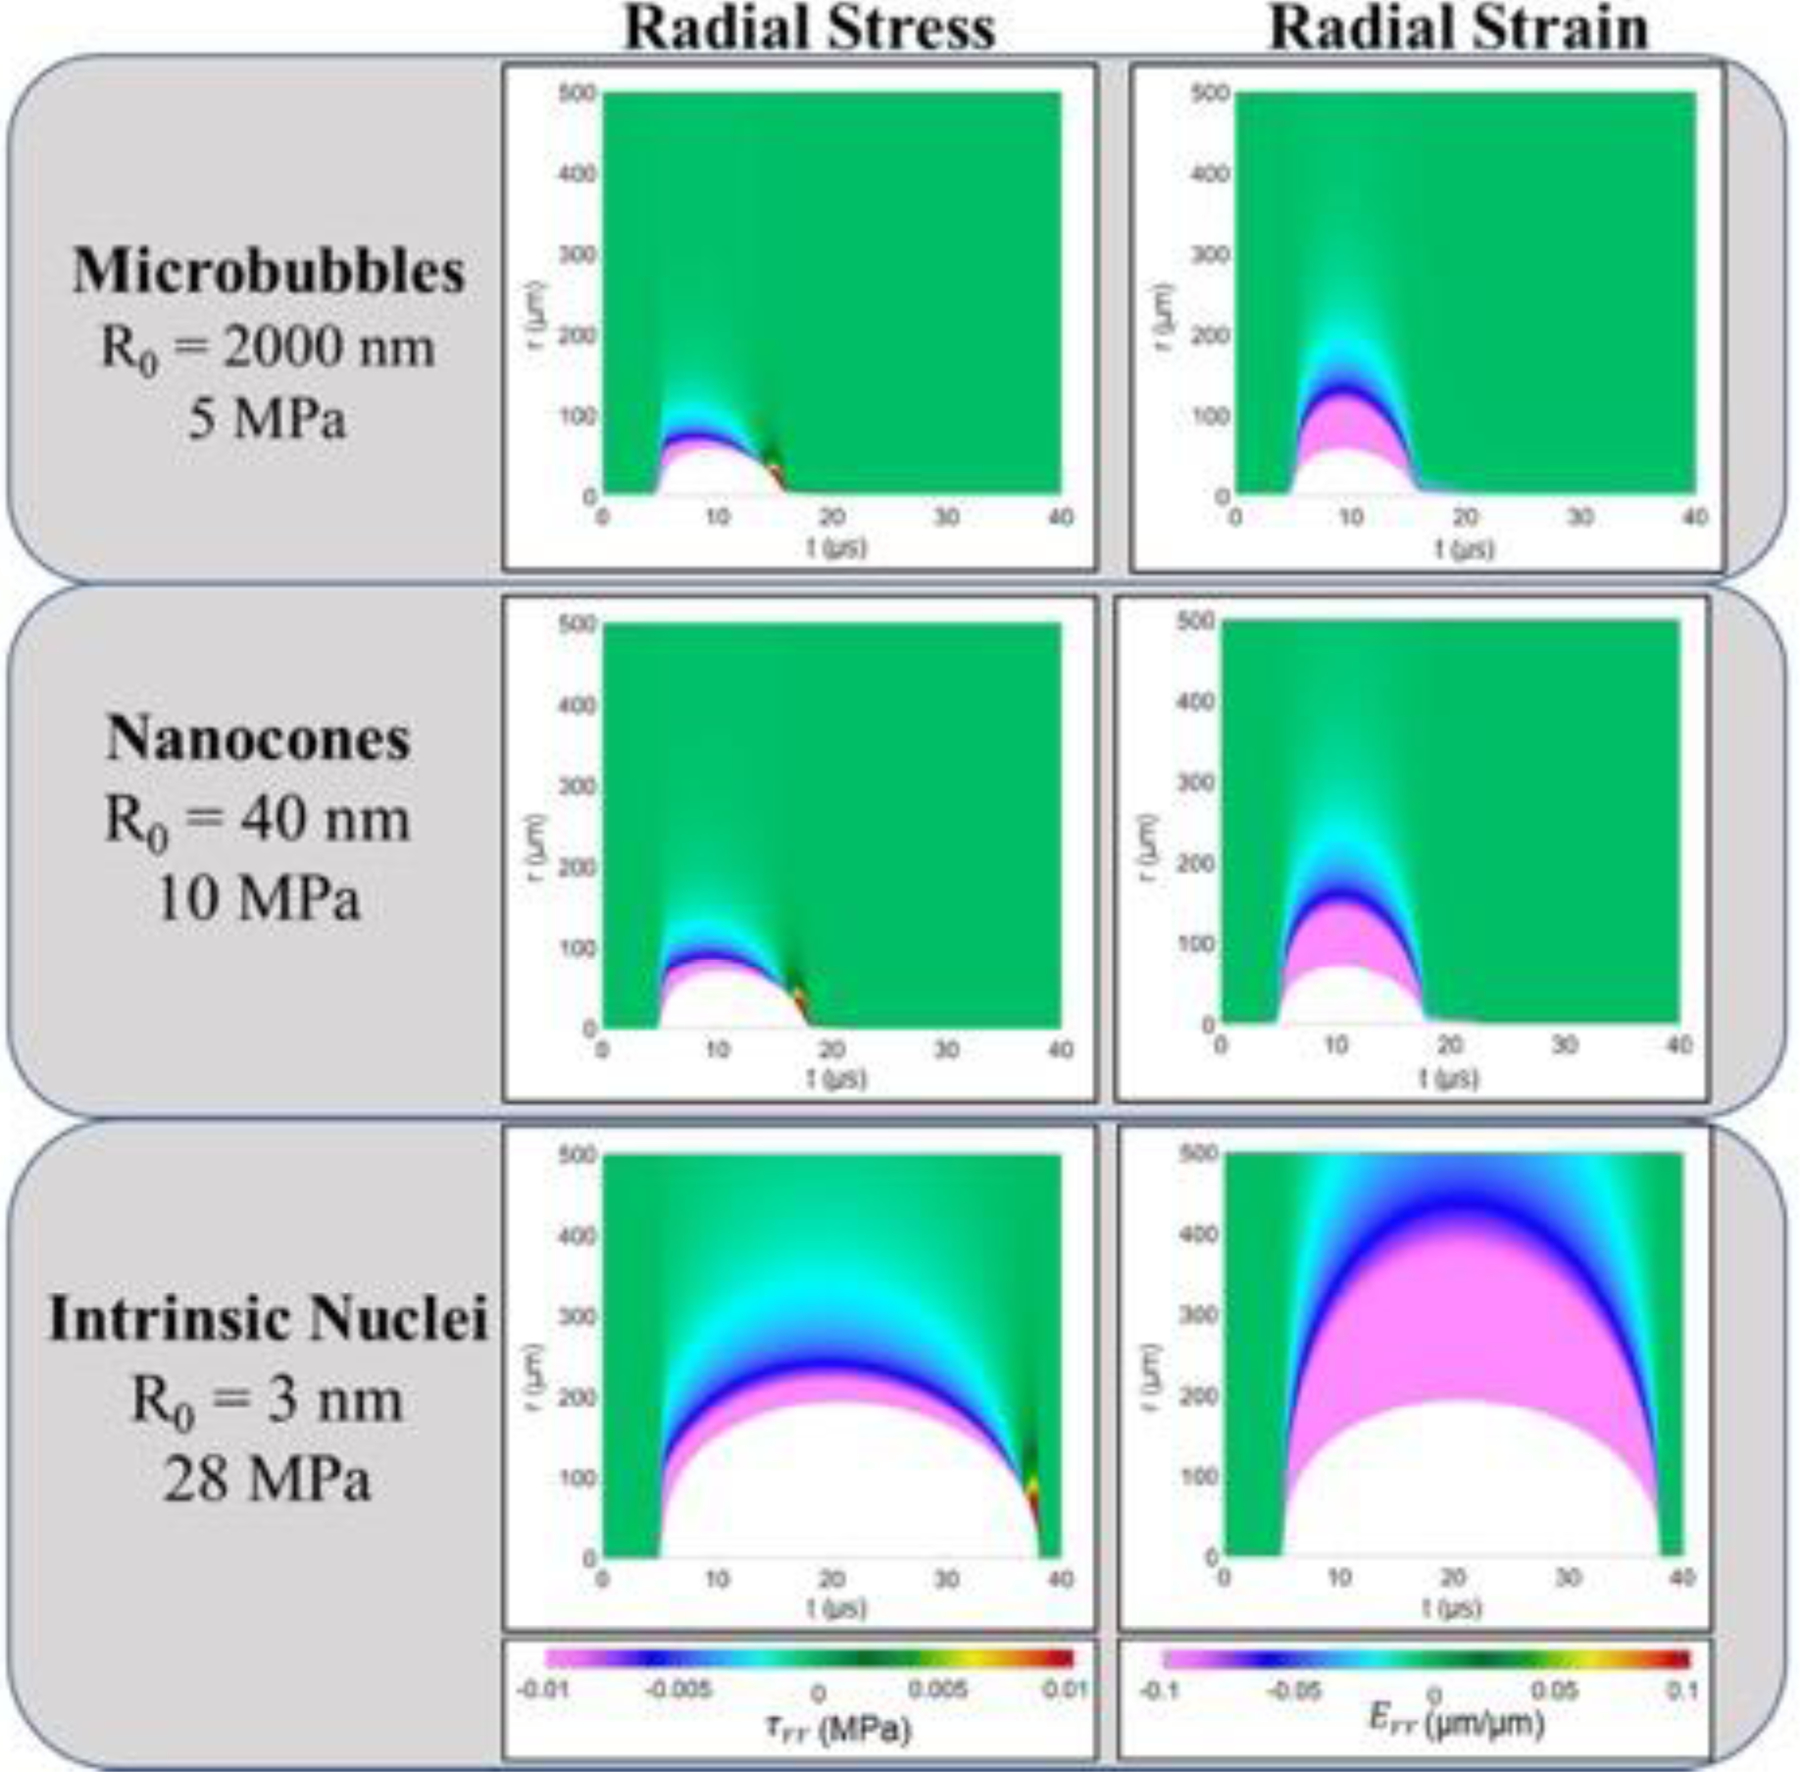
Figure 10.

Single Bubble Simulations. Radial deviatoric stress (left column) and radial strain (right column) surrounding a bubble for the three representative nucleation conditions. Contour plots show field quantities at material coordinate, r, as a function of time. White portions of each plot show the extent of material deformation by the bubble as a function of time under each condition.
