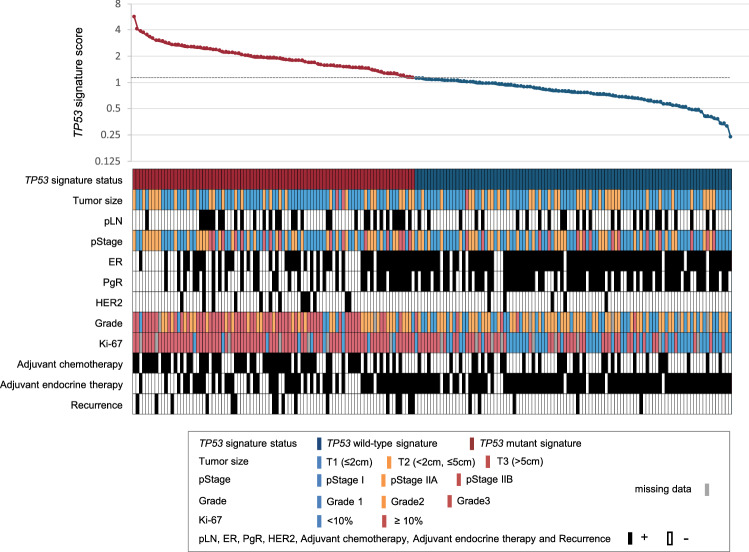
Fig. 2.
TP53 signature score and clinicopathological characteristics. The upper graph shows the TP53 signature score of each case in the validation cohort. Red and blue represents TP53 mutant signature and TP53 wild-type signature, respectively. The lower figure shows the clinicopathological characteristics of the corresponding cases in the upper graph. Legend of colors is shown in the figure. pStage, pathological stage; pLN, pathological lymph node; ER, estrogen receptor; PgR, progesterone receptor; HER2, human epidermal growth factor receptor type 2

