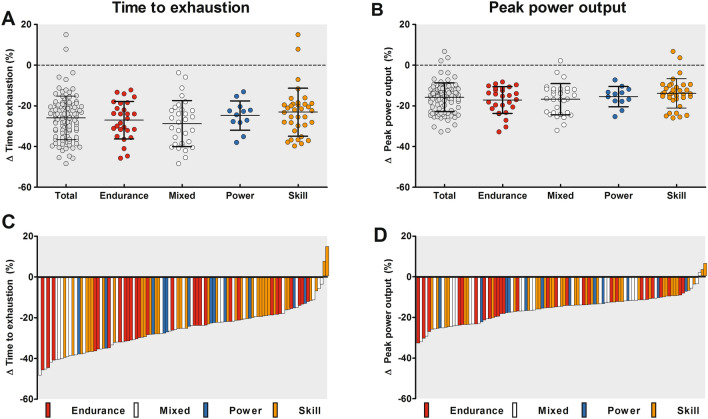
Fig. 1.
Group data (panels A + B) and individual data (panels C + D) of time to exhaustion (TTE) (panels A + C) and peak power output (PPO) (panels B + D) in the Tokyo condition relative to the control condition. Data in the upper panels are presented as mean ± SD. The relative changes in exercise performance were not different across sport disciplines. Each bar of panels C and D represent data from an individual athlete, highlighting the large interindividual variability in changes in exercise performance during exercise in the heat

