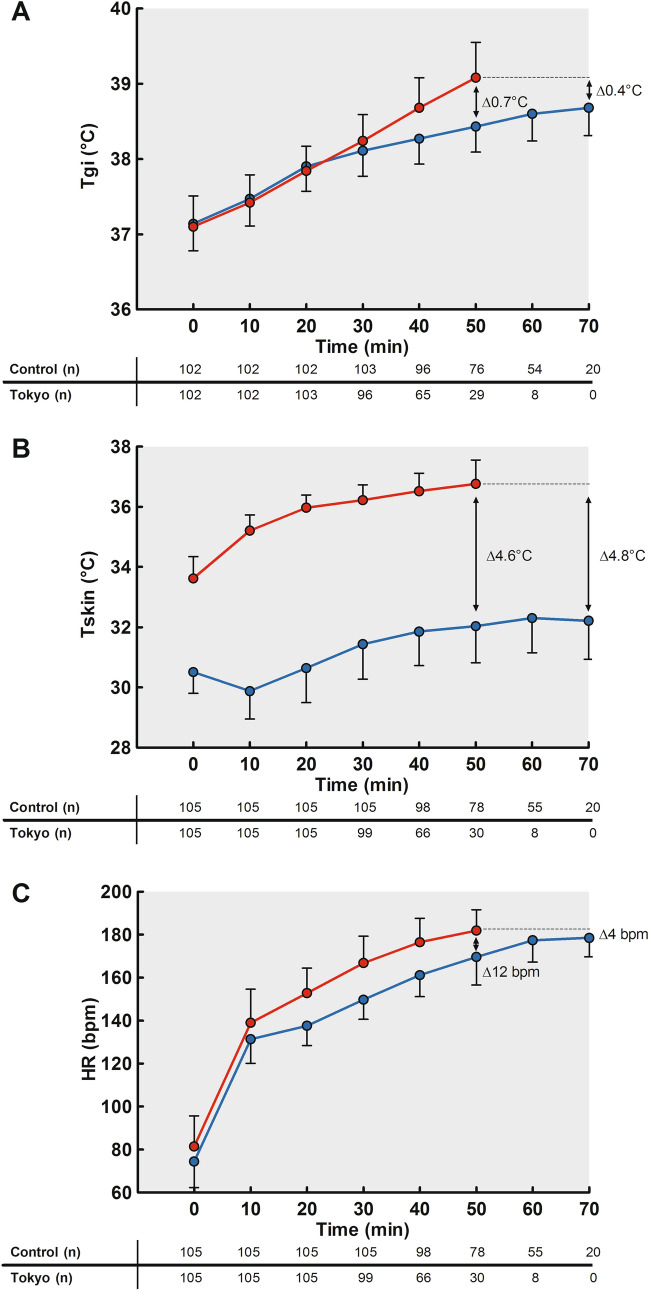
Fig. 2.
A Exercise-induced increases in gastrointestinal temperature (Tgi), B skin temperature (Tsk) and C heart rate (HR) during the control (blue lines) and Tokyo (red lines) conditions. A An increase in Tgi was observed in both conditions, with greater values in the Tokyo versus the control condition. B Tsk increased over time with greater values in the Tokyo versus the control condition. C HR values increased over time in both conditions, with higher values in the Tokyo versus the control condition. Data are presented as mean ± SD for all time points with a sample size > 10% of our cohort

