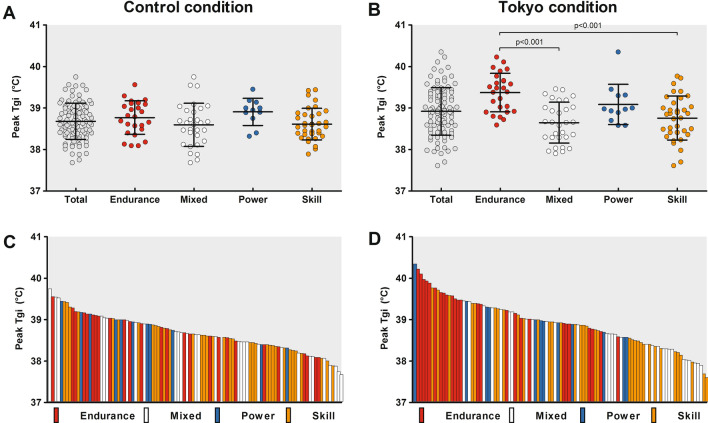
Fig. 3.
Group data (panels A + B) and individual data (panels C + D) of peak gastrointestinal temperature (Tgi) achieved during the control (panels A + C) and Tokyo (panel B + D) conditions. Data in the upper panels are presented as mean ± SD. Endurance athletes demonstrated a significantly higher peak Tgi in the Tokyo condition compared to mixed and skill athletes. Each bar of panels C and D represent data from an individual athlete, whereas the largest interindividual variability can be observed in the Tokyo condition

