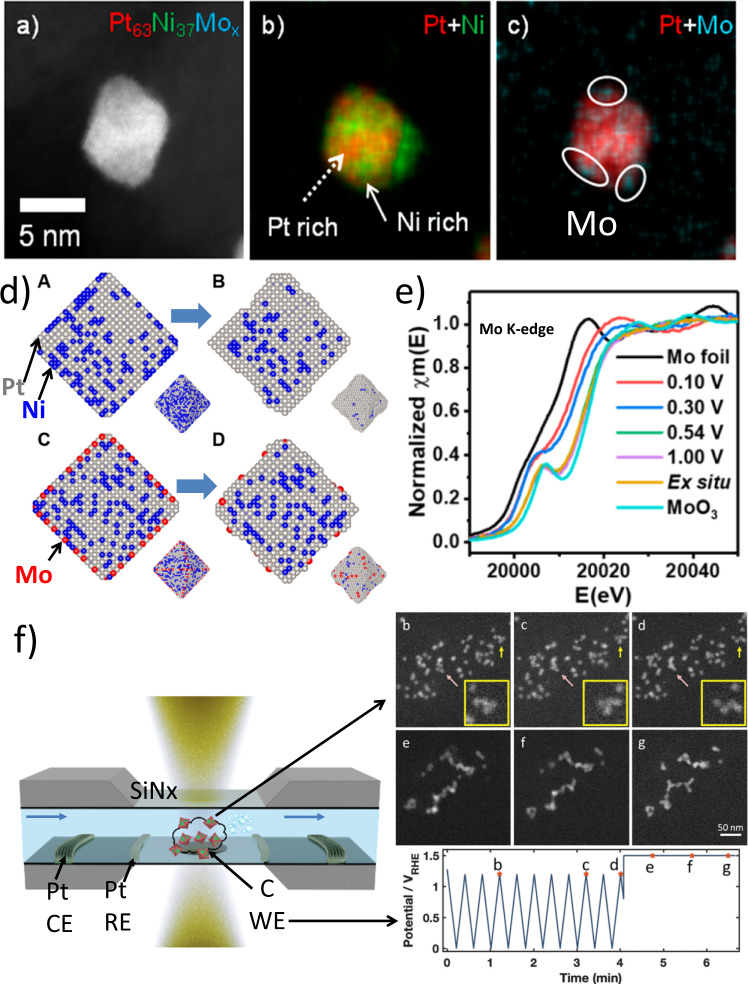
Fig. 2. Enhancing octahedral PtNi NPs catalysts: understanding surface doping and degradation mechanisms.
a–c TEM images showing elemental anisotropic Pt and Ni distribution and Mo surface dopants location on an oh-PtNi(Mo) catalyst44. d Middle cross-section of PtNi before (A) and after (B) and PtNiMo before (C) and after (D) evolution under kinetic Montecarlo (KMC) simulations at a temperature of 27 °C. The insets show snapshots of the 3D particles42. e The Mo K-edge XANES spectra were collected ex situ and in situ in an O2-purged 0.1 M HClO4 electrolyte as a function of applied potentials42. f Electrochemical liquid cell for in-situ TEM showing an example of degradation pathway involving coalescence (pink arrows) and particle motion (yellow arrows) during an electrochemical protocol. The potential profile over time is labeled with marked points (b–g) corresponding to the images. Right image-side adapted from ref. 47. Panels a–c from ref. 44 under CC BY NC licence. Panels d and e adapted with permission from ref. 42. Copyright 2017 American Chemical Society.

