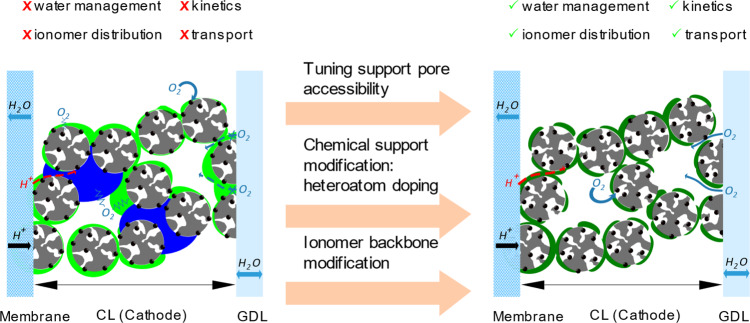
Fig. 4. Catalyst layer optimization.
Schematic illustration of a catalyst-coated membrane/gas diffusion layer (CCM/GDL) set consisting of a conventional high surface area carbon (gray porous sphere)-supported catalyst layer (left) and a tuned catalyst layer revealing optimized support/ionomer configuration (right). Proton and oxygen pathways through the ionomer layer (green) and the water droplets (blue) reaching the active sites (black sphere) are illustrated with red and blue arrows, respectively, and marked for high resistance pathways using the conventional sign of resistance. Red and green checkmarks indicate aspects that are challenging in current cathodes and are expected to be addressed in future catalyst layers. Three modification approaches (pink arrows) leading to improve catalyst layers are highlighted in the center of the illustration.

