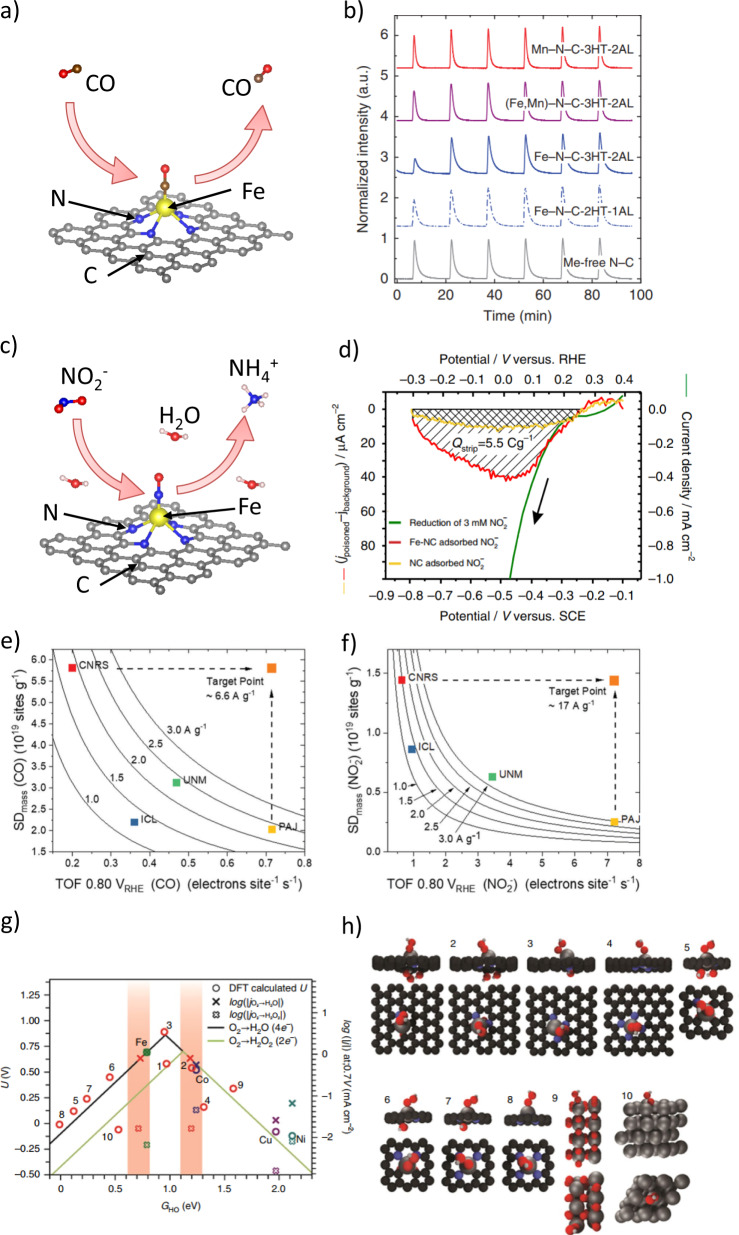
Fig. 5. Surface density and structure of the ORR active sites in MNCs.
a Scheme depicting CO cryo adsorption and temperature-programmed desorption (TPD), which enable counting the catalytically active FeNx sites on the surface of previously thermally cleaned Fe–N–Cs88. b CO pulse chemisorption profiles of MNCs catalysts: N–C (gray trace), two differently treated Fe–N–Cs (dashed and solid blue traces), (Fe,Mn)–N–C (violet trace), Mn–N–C (red trace)89. c Scheme for the nitrite reduction stripping charge method, showing the adsorption and stripping processes which enable calculating the SD on Fe–N–C under in-situ electrolyte conditions. d Comparison between homogeneous reduction of aqueous nitrite (green curve), and excess current associated with reductive stripping of nitrite adsorbed intermediates on Fe–N–C (red) or N–C catalyst (yellow). The reductive stripping curve is produced by subtracting the potential scan curves in N2-saturated electrolyte for unpoisoned and nitrite poisoned catalyst, where Qstrip is the coulometric charge associated with the NO stripping peak90. (e-f) Site density-ORR turnover frequency (SD-ORR TOF) maps were obtained by plotting the Fe surface SD and the corresponding TOF for four Fe–N–Cs catalysts with iso-mass activity hyperbolic curves at 0.80 VRHE. SD derived from CO (e) and NO2− (f) adsorption/desorption methods. Dashed arrows indicate examples of catalyst target performance86. g ORR activity volcano plot for SnNC structures and other MNCs (M = Cu, Co, Ni and Fe) displaying computed onset potentials (circles, left y-axis) and logarithm of the experimental RRDE disc and ring currents (thin and thick crosses, respectively, right y-axis) versus the reaction descriptor GHO80. The numeric labels on red circles correspond to the different Sn structures in panel (h), while the other colored circles are labeled with the active metal within an MN4C motif (structure 4 in panel h). The solid colored and black lines represent ORR thermodynamic limits caused by the scaling relations for 2e− and 4e− pathways, respectively. The red vertical bands, obtained by crossing SnNxC log(jdisc) with the thermodynamic volcano lines, highlight the GHO values for which SnNxC would follow the same activity relationship as the other MNCs, i.e. for the pyridinic motifs number 2. h Different Sn-N-C motifs shown with adsorbed *OOH. Hydroxyl groups below the carbon matrix avoid fictitious electronic contributions from the site substrate.

