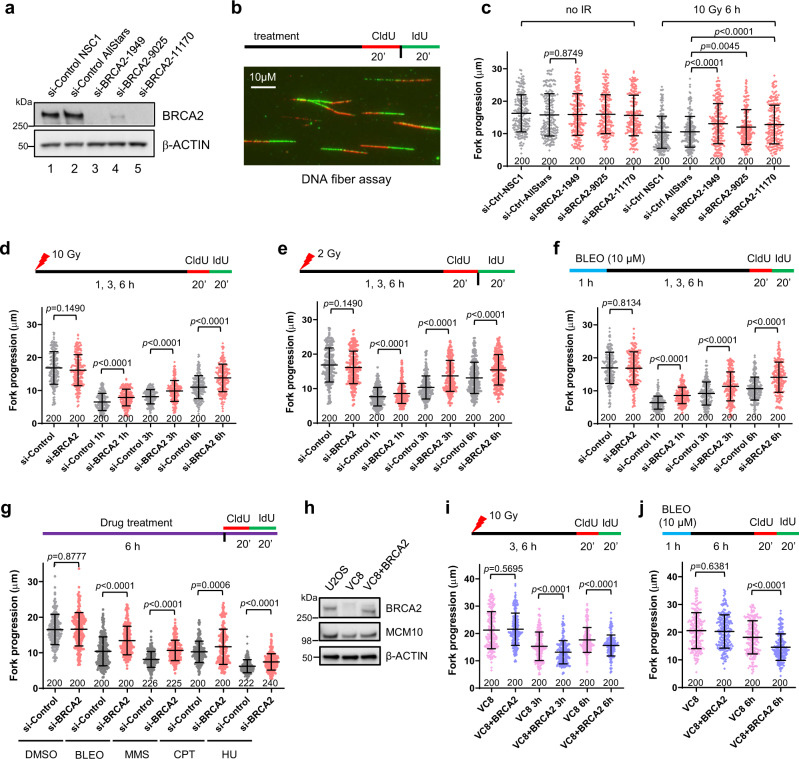
Fig. 1. BRCA2 restrains replication fork progression after DNA damage.
a Western blots showing levels of BRCA2 in U2OS cells treated with 2 different control and 3 different BRCA2 siRNAs. Similar results were obtained in n = 3 independent experiments. b Labeling scheme and a representative image of the DNA fiber assay. c Lengths of IdU-labeled replication tracts in U2OS cells treated with control and BRCA2 siRNA before and 6 h after 10 Gy of IR. d–f Replication tract lengths in U2OS cells treated with control (NSC1) and BRCA2 (1949) siRNAs before and 1, 3, and 6 h after treatment with 10 Gy of IR (d), 2 Gy of IR (e), or 10 µM of bleomycin (BLEO) (f). g Replication tract lengths in control and BRCA2-depleted U2OS cells after 6 h of continuous treatment with DMSO, BLEO (1 µM), MMS (50 µM), CPT (1 µM), and HU (50 µM). h Levels of BRCA2 and MCM10 in U2OS, VC8, and VC8 cells reconstituted with a human BRCA2 cDNA. i, j Replication tract lengths in VC8 and VC8 + BRCA2 cells before and 3 and 6 h after 10 Gy of IR (i) or 6 h after BLEO treatment (j). Data in (c–g) and (i, j) are presented as mean ± standard deviation (s.d.), with the number of dots shown below each column. Similar results were obtained from n = 2 biologically independent experiments. P values are calculated using two-tailed unpaired Student’s t test. Source data are provided as a Source Data file.

