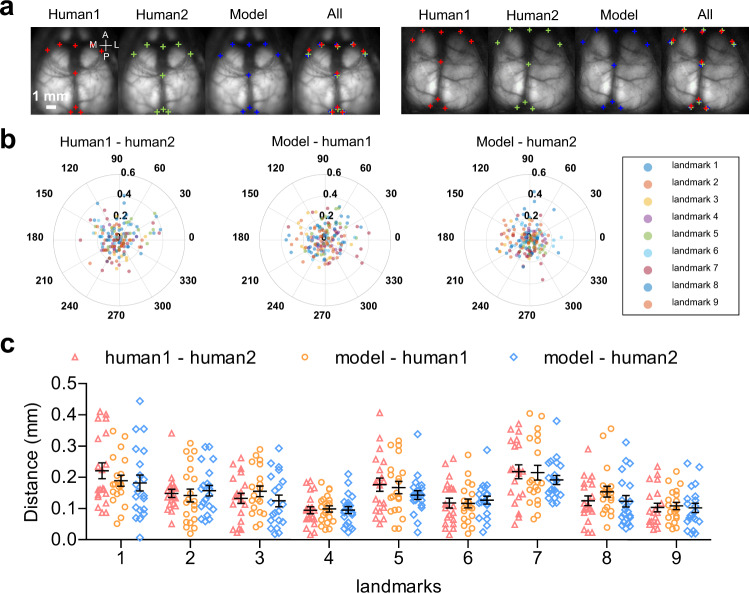
Fig. 2. Performance of automated landmark estimation.
a Examples of model labelled and manual labelled landmarks on GCaMP images (denoted by ‘+’ symbols; blue, model labelled; red and green, manual labelled). b Polar plot of distance between coordinates of model labelled and manual labelled landmarks. c Comparison of distance between coordinates of model labelled (n = 20 mice) and manual labelled landmarks (n = 20 mice) and distance calculated by differences between coordinates of two runs of manual labelled landmarks (n = 20 mice) (scatter dot plot, line at mean with SEM, Bonferroni tests (two-sided): human1 - human2 vs model - human1, p > 0.05; human1 - human2 vs model - human2, p > 0.05; model - human1 vs. model - human2, p > 0.05; mean distance and SEM for each landmark see Supplementary Table 2). Source data are provided as a Supplementary Data file.

