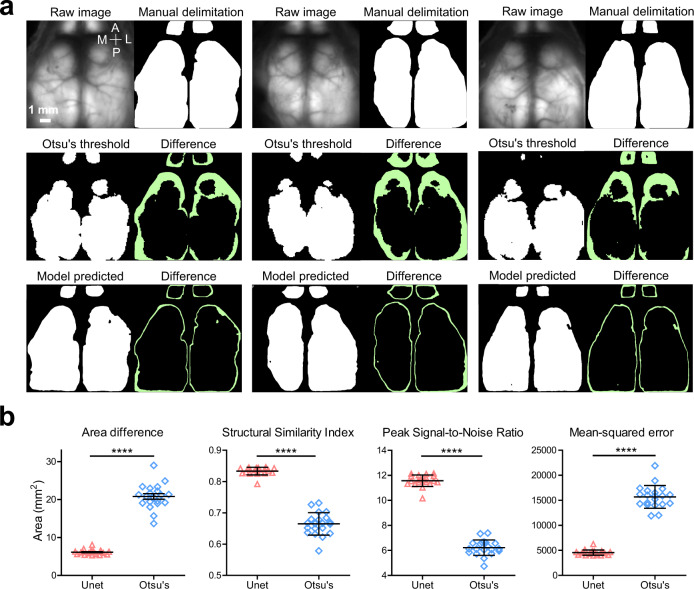
Fig. 3. Performance of automated delineation of brain boundary using U-Net.
a Representative images showing raw GCaMP images and respective human-applied brain delimitation as ground truth. Brain delimitation predictions from application of Otsu’s threshold (middle panel) and U-Net model segmentations (bottom panel). Green areas are the absolute differences between predicted versus ground truth. b Comparison of model-predicted (n = 20 mice) and Otsu’s threshold (n = 20 mice) brain delimitation results to ground truth by mean values for area difference (scatter dot plot, line at mean with SEM, paired t-test (two-tailed), ****p values <0.0001; U-Net, mean ± SEM = 6.11 ± 0.14; Otsu, mean ± SEM = 20.81 ± 0.73; p < 0.0001, t = 23.24), structural similarity index (U-Net, mean ± SEM = 0.83 ± 0.003; Otsu, mean ± SEM = 0.66 ± 0.01; p < 0.0001, t = 26.08), peak signal-to-noise ratio (U-Net, mean ± SEM = 11.57 ± 0.1; Otsu, mean ± SEM = 6.22 ± 0.14; p < 0.0001, t = 56.12) and mean squared error (U-Net, mean ± SEM = 4551 ± 115.9; Otsu, mean ± SEM = 15680 ± 507.7; p < 0.0001, t = 26.12). Source data are provided as a Supplementary Data file.

