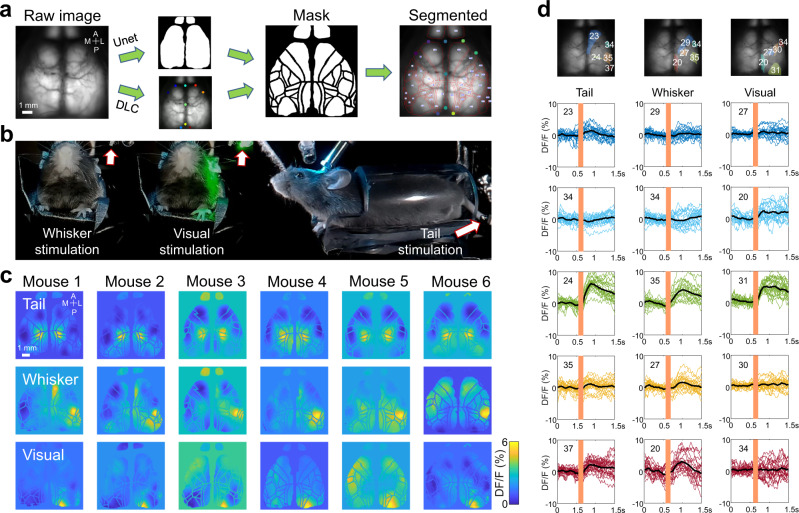
Fig. 4. Sensory mapping in awake mice.
a Automated alignment and segmentation pipeline of the atlas-to-brain approach. The raw GCaMP image was segmented using U-Net, and landmark estimation was done using DLC and then combined together to determine each brain region ROI. b Frontal and lateral view of an experimental set-up involving head-fixed mice with sensory stimulation cranial recording. c Sensory mapping across independent trials (n = 6 mice) shows similar regions of activation resulting from physical stimulation of the tail or whiskers and visual field of the mouse. d Single trials (n = 30 trials) of calcium temporal dynamics around the tail, whisker, and visual stimulations of different brain regions (indicated with the same colour on the brain image, the number of brain region ROIs are automatically output from MesoNet). The black line is the averaged calcium response of all the trials.

