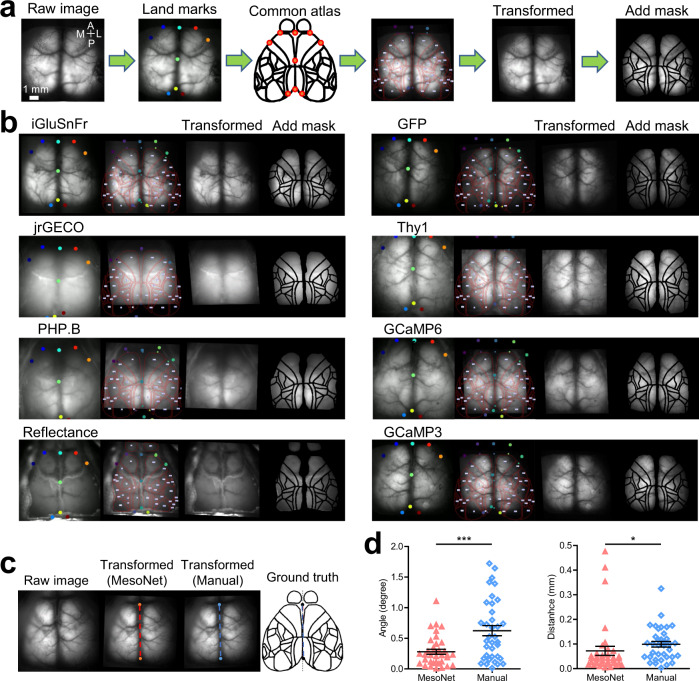
Fig. 5. Testing the brain-to-atlas approach across different lines of fluorescent protein mice.
a Automated registering and scaling pipeline of brain-to-atlas transformation (the fourth panel: big dots denote predicted landmarks on raw image, small dots denote landmarks on a common atlas, red line denote segmented brain regions; ©2004 Allen Institute for Brain Science. Allen Mouse Brain Atlas. Available from: http://mouse.brain-map.org/). b Example results of the brain-to-atlas transformation of brain image from different transgenic or virally injected mice. c Example images showing brain to atlas alignment using MesoNet or manually labelled landmarks (bregma, window margins). The performance of the alignment is based on the calculation of the distance between landmarks of anterior tip of the interparietal bone and cross point between the median line and the line which connects the left and right frontal pole, and angle of the midline compared to the ground truth common atlas, and angle of the midline compared to the ground truth common atlas (all distances and angles are reported as positive deviations compared to ground truth common atlas). d Distribution of the angle (scatter dot plot, line at mean with SEM, ***p values < 0.001, * denote p values <0.05; MesoNet, mean ± SEM = 0.28 ± 0.04; Manual, mean ± SEM = 0.62 ± 0.08; Wilcoxon signed-rank test, Two-tailed, p = 0.0005, Sum of signed ranks (W) = −446, n = 36 mice) and distance (MesoNet, mean ± SEM = 0.07 ± 0.02; Manual, mean ± SEM = 0.1 ± 0.01; Wilcoxon signed-rank test, Two-tailed, p = 0.0122, Sum of signed ranks (W) = −320, n = 36 mice). MesoNet performs significantly better in both comparisons. Source data are provided as a Supplementary Data file.

