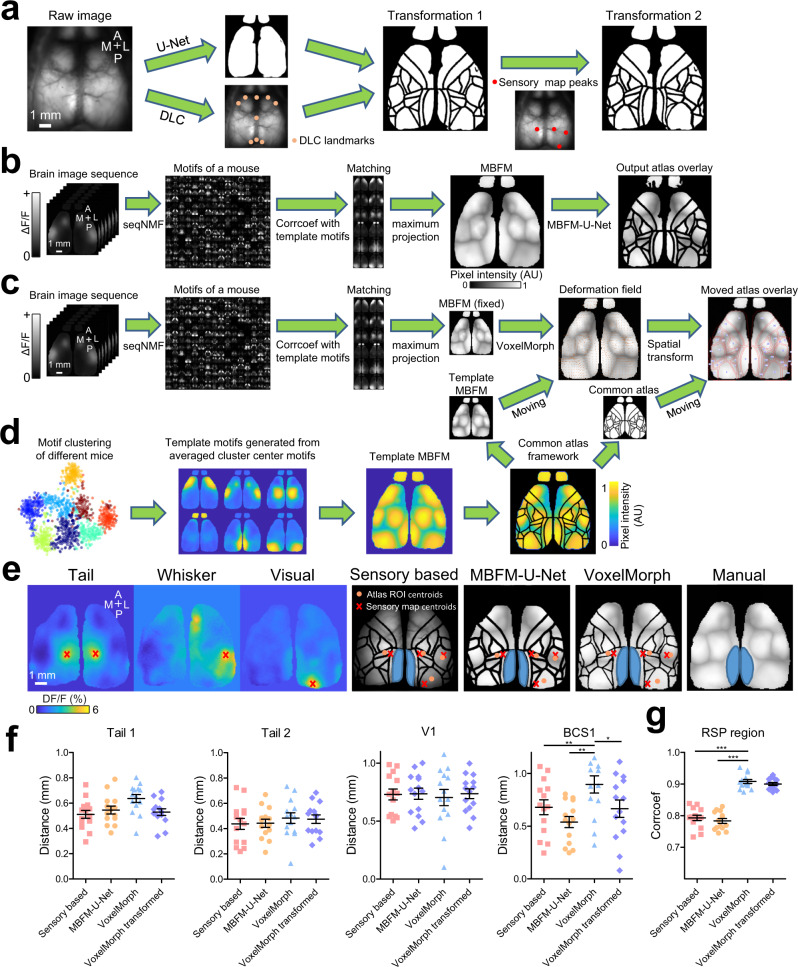
Fig. 7. Performance of functional sensory map and activity-motif alignment pipelines.
a Sensory map-based alignment by combining nine landmarks plus U-Net pipeline with functional sensory maps (tail, visual, and whisker stimulation-induced peak activation) to align the reference atlas to brain image. b A spontaneous activity motif matching procedure was used to generate motif-based functional map (MBFM) using calcium imaging data detected by seqNMF. The MBFM was then used to predict brain regional boundaries using MBFM based U-Net model (MBFM-U-Net). c The MBFM is used to predict a deformation field corresponding to a template MBFM using VoxelMorph. The deformation field will then be applied to the reference atlas to fit input MBFM. d The generation of template MBFM (see Methods). Different colors in t-SNE plot indicate different motif clusters. e Example images show the sensory maps and output atlas from sensory-based, MBFM-U-Net and VoxelMorph pipelines and manually painted RSP region on MBFM (blue). f Comparison of the performance of the pipelines (sensory-based, MBFM, VoxelMorph, and VoxelMorph after brain-to-atlas transformation of the MBFMs) by calculating the euclidean distance between the centroids of sensory stimulation-induced activation and predicted atlas ROIs (Tail, V1, and BCS1). Scatter dot plot, the line at mean with SEM, one-way ANOVA with Dunn’s Multiple Comparison Test. ***p < 0.001, **p < 0.01, *p < 0.05; Sensory-based vs. Voxelmorph, p < 0.05, rank = −22; MBFM-U-Net vs Voxelmorph, p < 0.05, rank = −25; VoxelMorph vs VoxelMorph transformed, p < 0.05, rank = 21, n = 14 mice). g Comparison of the performance of the pipelines (sensory-based, MBFM-U-Net, VoxelMorph and VoxelMorph after brain-to-atlas transformation) by calculating the correlation coefficient between manually painted RSP region (ground truth) and predicted RSP region by different pipelines. VoxelMorph performed significantly better than other pipelines (Sensory based vs VoxelMorph, p < 0.05, rank = −29; MBFM-U-Net vs VoxelMorph, p < 0.05, rank = −33; Sensory based vs VoxelMorph transformed, p < 0.05, rank = −23; MBFM-U-Net vs VoxelMorph transformed, p < 0.05, rank = −27, n = 14 mice). Source data are provided as a Supplementary Data file.

