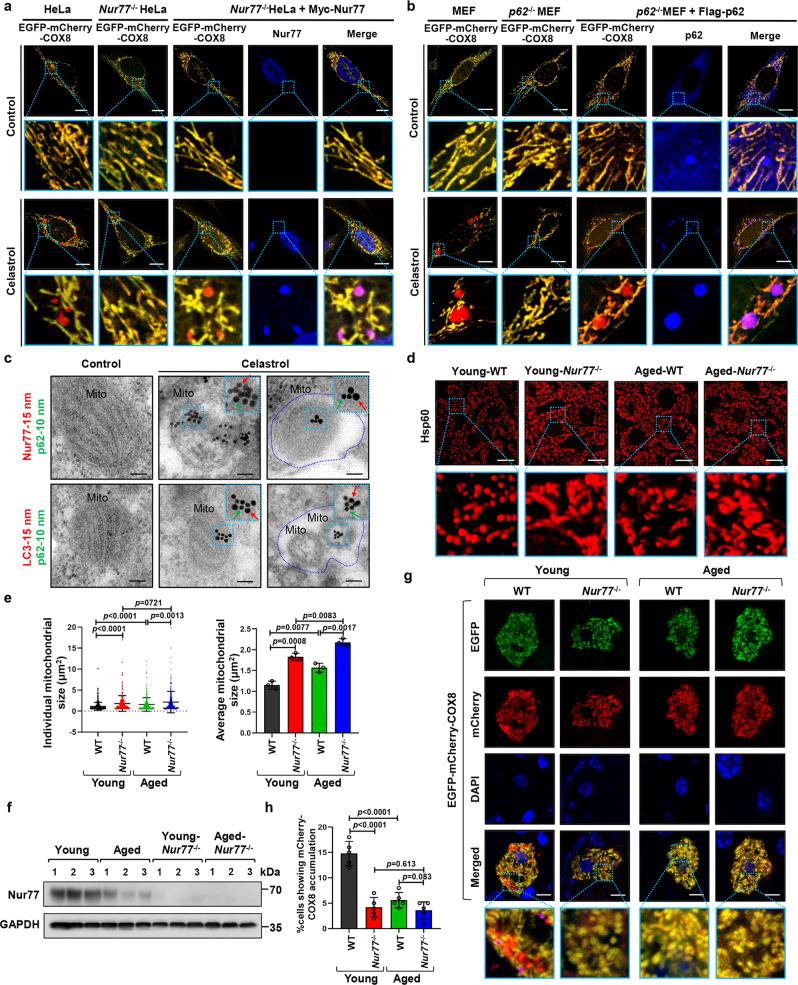
Fig. 1. Nur77 and p62 are required for celastrol-induced mitophagy.
a Representative image of celastrol-induced mitophagy in HeLa, Nur77−/−HeLa, and Nur77−/−HeLa cells transfected with Myc-Nur77 by EGFP-mCherry-COX8 assay as described in Methods. Scale bar, 10 μm. b Representative images of celastrol-induced mitophagy in MEFs and p62−/−MEFs by EGFP-mCherry-COX8 assay as described in Methods. Scale bar, 10 μm. c Colocalization of Nur77, LC3, and p62 with mitochondria within mitophagosome/autolysosome. Upper panel: Electron micrographs of HeLa cells stained with 15 nm immunogold-conjugated Nur77 antibody to detect Nur77 (red), and 10 nm immunogold-conjugated p62 antibody to detect p62 (green). Bottom panel: Electron micrographs of HeLa cells stained with 15 nm immunogold-conjugated LC3 antibody to detect LC3, and 10 nm immunogold-conjugated p62 antibody to detect p62. Cells were treated for 1 h with celastrol. The blue dotted line indicates mitophagosome/autolysosome. Mito mitochondrion, Scale bar, 200 nm. d Representative images showing Hsp60, a mitochondrial marker, in the liver tissue from wild-type and Nur77−/−mice in aging model. Young mice, 8 weeks old. Aged mice, 2 years old. Scale bar, 10 μm. e Statistical analysis of mitochondrial size was represented from liver tissue. Left graph, n = 316, 253, 267, and 287, respectively; Right graph, n = 3 biologically independent samples. A two-tailed unpaired Student’s t-test was used for statistical analysis, and data were presented as mean values ± SEM. f The expression of Nur77 protein in the liver tissue from wild-type and Nur77−/−mice in the aging model. g Representative images of EGFP-mCherry-COX8 in the liver from wild-type or Nur77−/−mice in the aging model. Purple arrows indicate mitophagy. Scale bar, 2 μm. h Quantification of cells showing mCherry-COX8 accumulation on liver tissue. Two-tailed unpaired Student’s t-test was used for statistical analysis, and data were presented as mean values ± SEM (n = 5 mice per group). Data represent at least three independent experiments. Source data are provided as a Source Data file.

