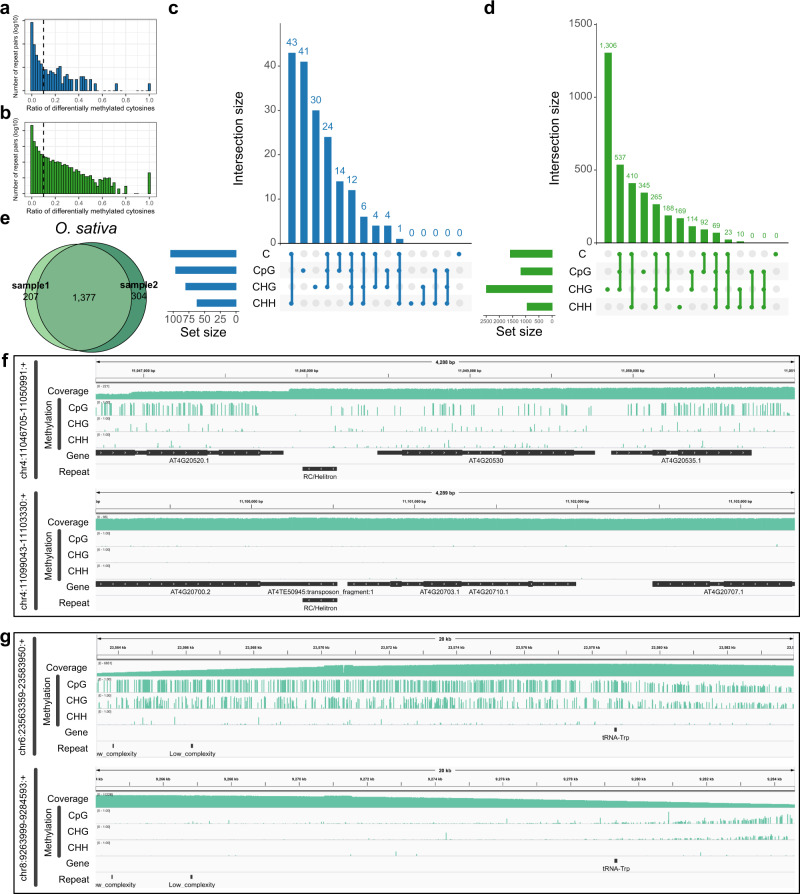
Fig. 4. Differentially methylated repeat pairs identified by DeepSignal-plant.
a, b Ratio of differentially methylated cytosines to total cytosines in each repeat pair of A. thaliana (a) and O. sativa (sample1) (b). The black dash lines (10%) indicate repeat pairs are differentially methylated (right) or not (left). c, d Matrix layout55 for all intersections of four sets of differentially methylated repeat pairs profiled by cytosines, CpG sites, CHG sites, and CHH sites independently, in A. thaliana (c) and O. sativa (sample1) (d). Circles below in each column indicate sets that are part of the intersection; the up bars indicate the size of each intersection; the left bars indicate the total size of each set. e Comparison of differentially methylated repeat pairs identified by methylation of cytosines in O. sativa sample1 and sample2. f Genome browser view of a differentially methylated repeat pair (chr4:11046705–11050991:+, chr4: 11099043–11103330:+) in A. thaliana. g Genome browser view of a differentially methylated repeat pair (chr6:23563359–23583950:+, chr8: 9263999–9284593:+) in O. sativa (sample1). Source data underlying f and g are provided as a Source Data file.

