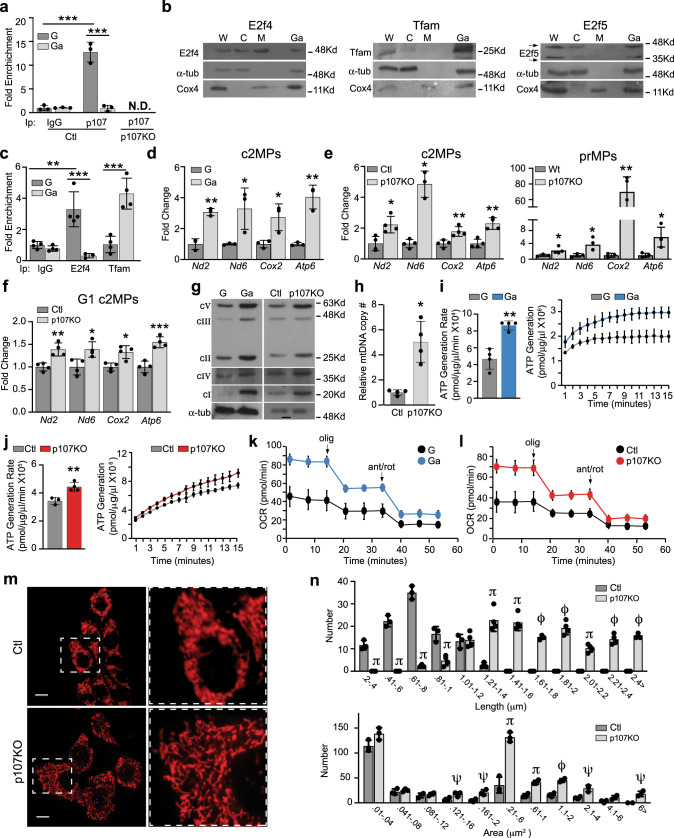
Fig. 2. p107 down regulates mitochondrial ATP generation capacity.
a Graphical representation of relative p107 and IgG mitochondrial DNA occupancy by qChIP analysis during proliferation (G) and growth arrest (Ga) in control (Ctl) and p107KO c2MPs. Data are presented as mean values ± SD (n = 3 biologically independent samples). Two-way Anova with post hoc Tukey ***p < 0.001 G (IgG vs. p107) and *** p < 0.001 ChIP p107 (G vs Ga), N.D. (not detected). b Representative Western blot of proliferating whole cell (W), cytoplasmic (C), mitochondrial (M) and growth arrested (Ga) cells for E2f4, Tfam, E2f5, α-tub and Cox4 lysates. c Graphical representation of relative E2f4, Tfam and IgG mitochondrial DNA occupancy by qChIP analysis during proliferation (G) and growth arrest (Ga) in control c2MPs, Data are presented as mean values ± SD (n = 4 biologically independent samples). Two-way Anova with post hoc Tukey, **p = 0.0014 G (IgG vs. E2f4), ***p < 0.001 ChIP E2f4 (G vs Ga) and ***p < 0.001 ChIP Tfam (G vs Ga). Gene expression analysis by RT-qPCR of mitochondrial-encoded genes Nd2, Nd6, Cox2, and Atp6 for: d c2MPs during G and Ga (n = 3 biologically independent samples), e Ctl and p107KO c2MPs and Wt and p107KO prMPs during proliferation (n = 4 biologically independent samples) and f Ctl and p107KO c2MPs in G1 phase of the cell cycle (n = 4 biologically independent samples). Data are presented as mean values ± SD. Two-tailed unpaired Student’s t test: G and Ga *p = 0.0415 (Nd6), 0.0291 (Cox2), **p = 0.0012 (Nd2), 0.0025 (Atp6); Ctl and p107KO: *p = 0.0139 (Nd2), 0.0114 (Nd6), **p = 0.00186 (Atp6), 0.00834 (Cox2) and Wt and p107KO *p = 0.0418 (Nd2), 0.0371 (Nd6), 0.0330 (Atp6), **p = 0.0058 (Cox2), and Ctl and p107KO c2MPs in G1 phase *p = 0.0195 (Nd6), 0.0110 (Cox2), **p = 0.0062 (Nd2), ***p < 0.001 (Atp6). g Representative Western blot of G compared to Ga, and Ctl compared to p107KO c2MPs for each electron transport chain complex (c) subunits, cI (NDUFB8), cII (SDHB), cIII (UQCRC2), cIV (MTCO) and cV (ATP5A). h Relative mitochondrial DNA (mtDNA) copy number (#) for control (Ctl) and p107KO c2MPs. Data are presented as mean values ± SD (n = 4 biologically independent samples). Two-tailed unpaired Student’s t test, *p = 0.0145. ATP generation rate and capacity over time for isolated mitochondria from (i) G and Ga c2MPs and (j) Ctl and p107KO c2MPs. Data are presented as mean values ± SD (n = 4 biologically independent samples). Two-tailed unpaired Student’s t test, G and Ga c2MPs **p = 0.0037 and Ctl and p107KO c2MPs **p = 0.0057. For capacity significance statistics see Supplementary Table 1a, b. Live cell metabolic analysis by Seahorse for oxygen consumption rate (OCR) with addition of oligomycin (olig) and antimycin A (ant), rotenone (rot) for (k) G and Ga c2MPs and (l) Ctl and p107KO c2MPs, Data are presented as mean values ± SD (n = 8 G, 10 Ga, 4 Ctl and 6 p107KO biologically independent samples). m Representative confocal microscopy live cell image of stained mitochondria (MitoView Red) for Ctl and p107KO c2MPs (scale bar 10 μm). n Graphical representation of mitochondria number per grouped lengths and areas using image J quantification. Data are presented as mean values ± SD (n = 3 biologically independent samples). Two-tailed unpaired Student’s t test, significance denoted by ψ = p < 0.05, π = p < 0.01, ϕ = ***p < 0.001. Detailed statistics in Supplementary Table 2. Source data are provided as a Source Data file.

