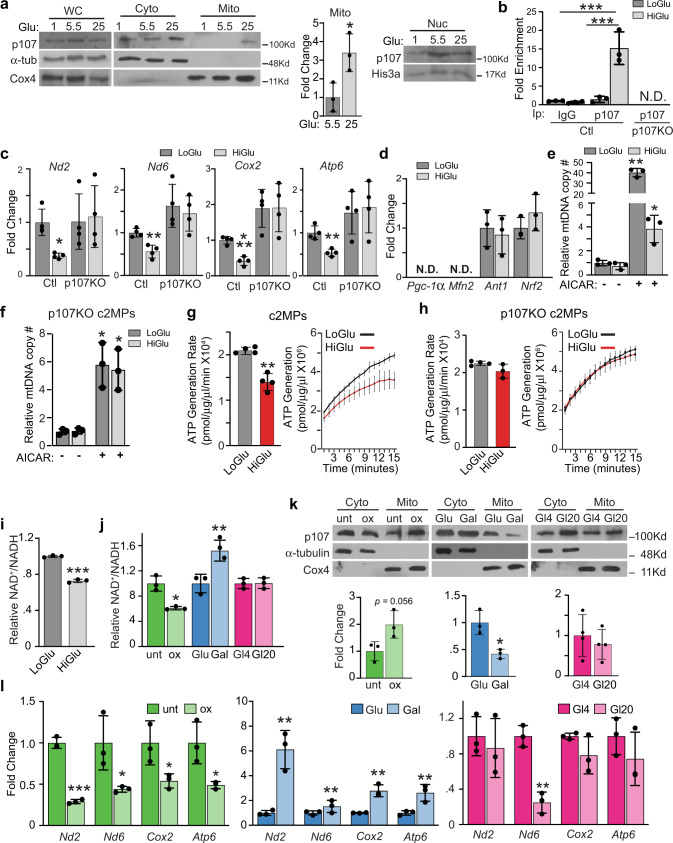
Fig. 3. p107 discerns the NAD+/NADH ratio to regulate mitochondrial gene expression and Oxphos.
a Representative Western blot and graphical representation of whole cell (WC), cytoplasmic (Cyto), mitochondrial (Mito) and nuclear (Nuc) fractions from c2MPs grown in stripped media (SM) containing only 1.0 mM, 5.5 mM or 25 mM glucose (Glu) for p107, α-tub, Cox4, and His3a. Graphical data are presented as mean values ± SD (n = 3 biologically independent samples). Two-tailed unpaired Student’s t test, *p = 0.0314. b Graphical representation of relative p107 and IgG mitochondrial DNA occupancy by qChIP analysis for control (Ctl) and p107KO c2MPs grown in SM containing only 5.5 mM (LoGlu) or 25 mM (HiGlu) glucose. Data are presented as mean values ± SD (n = 3 biologically independent samples). Two-way Anova with post hoc Tukey, ***p < 0.001 (LoGlu IgG vs. HiGlu p107) and ***p < 0.001 ChIP p107 (LoGlu vs HiGlu), N.D. is not detected. c RT-qPCR of Nd2, Nd6, Cox2, and Atp6 for Ctl and p107KO c2MPs grown in SM containing LoGlu or HiGlu. Data are presented as mean values ± SD (n = 4 biologically independent samples). Two-tailed unpaired Student’s t test, HiGlu vs. LoGlu Ctl, *p = 0.0132 (Nd2), **p = 0.0041 (Nd6), 0.0041 (Atp6), ***p < 0.001 (Cox2). d RT-qPCR of Pgc-1α, Mfn2, Ant1, and Nrf2 for c2MPs grown in SM containing LoGlu or HiGlu. Data are presented as mean values ± SD (n = 3 biologically independent samples) Two-tailed unpaired Student’s t test, N.D. (not detected). Relative mitochondrial DNA (mtDNA) copy number (#) for (e) c2MPs and (f) p107KO c2MPs grown in SM containing LoGlu or HiGlu in the absence or presence of 5-aminoimidazole-4-carboxamide ribonucleotide (AICAR), Data are presented as mean values ± SD (n = 3 biologically independent samples). Two-tailed unpaired Student’s t test, for c2MPs *p = 0.0454 (HiGlu vs. HiGlu AICAR), **p = 0.0035 (LoGlu vs. LoGlu AICAR) and for p107KO c2MPs *p = 0.0336 (LoGlu vs. LoGlu AICAR), 0.0333 (HiGlu vs. HiGlu AICAR). ATP generation rate and capacity over time for isolated mitochondria from (g) c2MPs and (h) p107KO c2MPs, grown in SM containing LoGlu or HiGlu. Data are presented as mean values ± SD (n = 4 biologically independent samples). Two-tailed unpaired Student’s t test, for c2MP rate **p = 0.0025. For capacity significance statistics see Supplementary Table 1c. i NAD+/NADH ratio for c2MPs grown in SM containing LoGlu or HiGlu. Data are presented as mean values ± SD (n = 3 biologically independent samples). Two-tailed unpaired Student’s t test, ***p < 0.001. j NAD+/NADH ratio for c2MPs untreated (unt) or treated with 2.5 mM oxamate (ox), grown in 25 mM glucose (Glu) or 10 mM galactose (Gal) or with varying glutamine concentrations of 4 mM (Gl4) or 20 mM (Gl20). Data are presented as mean values ± SD (n = 3 biologically independent samples). Two-tailed unpaired Student’s t test, *p = 0.0251, **p = 0.0079. k Representative Western blots and graphical representation of mitochondrial (Mito) fractions of cells treated as in (j). Data are presented as mean values ± SD (n = 3 biologically independent samples). Two-tailed unpaired Student’s t test, p = 0.0560 ox and *p = 0.0143 Gal. l RT-qPCR analysis of cells treated as in (j). Data are presented as mean values ± SD (n = 3 biologically independent samples). Two-tailed unpaired Student’s t test; for ox *p = 0.0394 (Nd6), 0.0466 (Cox2), 0.0263 (Atp6), ***p < 0.001 (Nd2) for Gal **p = 0.0079 (Nd2), 0.0075 (Nd6), 0.0049 (Cox2), 0.0065 (Atp6) and for Gl20 **p = 0.0016 (Nd6). Source data are provided as a Source Data file.

