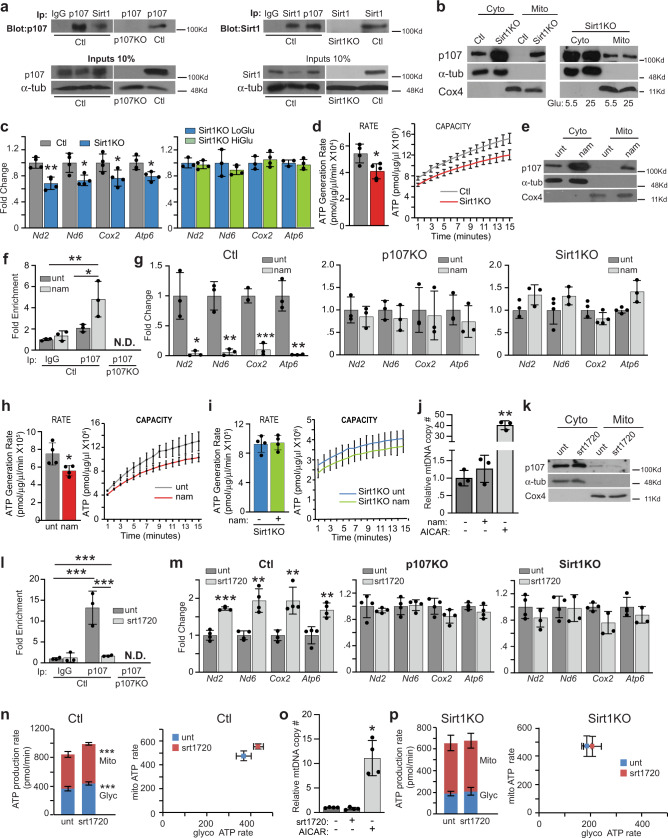
Fig. 4. p107 is regulated by Sirt1.
a Immunoprecipitation/Western blots for p107 and Sirt1 in control (Ctl) and p107KO c2MPs. b Representative Western blot of cytoplasmic (Cyto) and mitochondrial (Mito) fractions of Ctl and Sirt1KO c2MPs grown in stripped media with 5.5 mM and 25 mM glucose. c RT-qPCR of Nd2, Nd6, Cox2 and Atp6 for Ctl and Sirt1KO c2MPs and Sirt1KO c2MPs grown in stripped media with 5.5 mM (LoGlu) and 25 mM (HiGlu) glucose. Data are presented as mean values ± SD (n = 4 biologically independent samples). Two-tailed unpaired Student’s t test, *p = 0.0261 (Nd6), 0.0431 (Cox2), 0.0211 (Atp6), **p = 0.0026 (Nd2). d Isolated mitochondrial ATP generation rate and capacity over time for Ctl and Sirt1KO c2MPs grown in 5.5 mM glucose. Data are presented as mean values ± SD (n = 4 biologically independent samples). Two-tailed unpaired Student’s t test, *p = 0.0228. For capacity significance statistics see Suppl. Table 1d. e Representative Western blot of Cyto and Mito fractions of c2MPs untreated (Ctl) or treated with Sirt1 inhibitor nicotinamide (nam) or (k) activator srt1720. Graphical representation of relative p107 and IgG mitochondrial DNA occupancy by qChIP analysis in Ctl and p107KO c2MPs untreated (unt) or treated with (f) nam and (l) srt1720. Data are presented as mean values ± SD (n = 3 nam and ctl and 4 srt1720 and ctl biologically independent samples). Two-way Anova with post hoc Tukey *p = 0.0232 ChIP p107 (unt vs. nam),**p = 0.0035 (IgG unt vs. p107 nam), ***p < 0.001 (IgG unt vs. p107 unt), (IgG unt vs. p107 srt1720) and ChIP p107 (unt vs. srt1720). RT-qPCR of Nd2, Nd6, Cox2, and Atp6 for Ctl, p107KO and Sirt1KO c2MPs unt and treated with (g) nam and (m) srt1720. Data are presented as mean values ± SD (n = 3 for nam and ctl and 4 for srt1720 and ctl biologically independent samples). Two-tailed unpaired Student’s t test. For nam treated cells *p = 0.0129 (Nd2), **p = 0.0026 (Nd6), 0.0026 (Atp6), ***p < 0.001 (Cox2) srt1720 treated cells, **p = 0.0059 (Nd6), 0.0091 (Cox2), 0.0042 (Atp6), ***p < 0.001 (Nd2). Isolated mitochondria ATP generation rate and capacity over time for h Ctl and i Sirt1KO c2MPs treated and untreated with nam. Data are presented as mean values ± SD (n = 4 biologically independent samples). Two-tailed unpaired Student’s t test, *p = 0.0480. For ATP capacity statistics see Suppl. Table 1e. j Mitochondria DNA (mtDNA) copy number (#) for c2MPs with and without AICAR and nam. Data are presented as mean values ± SD (n = 3 biologically independent samples). One-way Anova with Tukey post hoc test, **p = 0.0035. ATP production from mitochondria (Mito) and glycolysis (Gly) for (n) Ctl (n = 8 biologically independent samples) and (p) Sirt1KO c2MPs (n = 9 biologically independent samples) treated and untreated with srt1720. Data are presented as mean values ± SD. Two-tailed unpaired Student’s t test, ***p < 0.001. o mtDNA copy # for c2MPs with and without AICAR and srt1720. Data are presented as mean values ± SD (n = 4 biologically independent samples). Two-tailed unpaired Student’s t test, *p = 0.0111. Source data are provided as a Source Data file.

