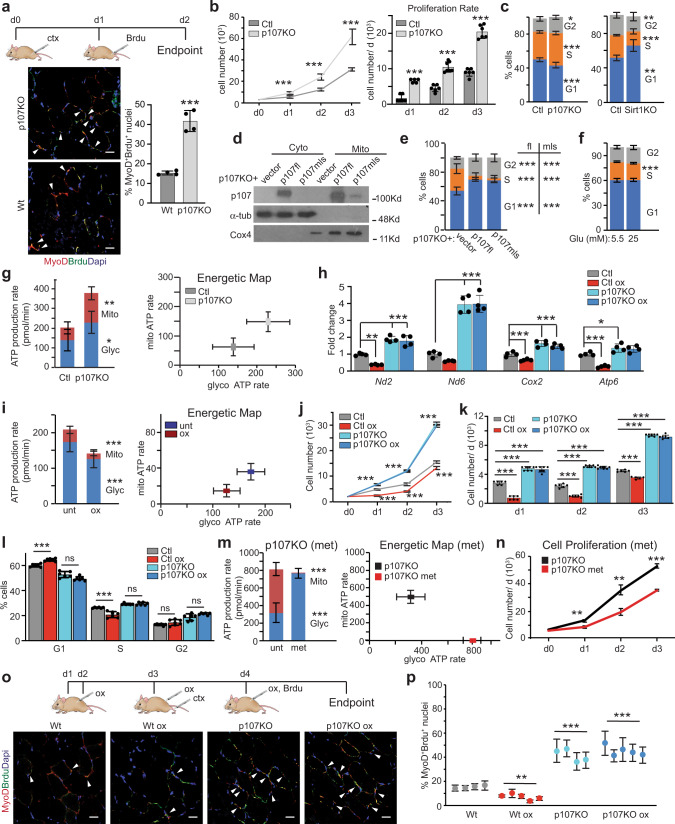
Fig. 5. p107 directs the cell cycle rate through management of Oxphos generation.
a Time course of treatments for wild type (Wt) and p107KO mice injected with cardiotoxin (ctx) and bromodeoxyuridine (Brdu). Representative confocal immunofluorescence merge image of MyoD, Brdu and Dapi and graph depicting the percentage of proliferating myogenic progenitors from tibialis anterior muscle at day 2 post injury. Data are presented as mean values ± SD (n = 4 independent animals). Two-tailed unpaired Student’s t test, ***p < 0.001. Arrows denote Brdu and MyoD positive nuclei. (scale bar 20 μm). b Growth curve and proliferation rate during 3 days for control (Ctl) and p107KO c2MPs. Data are presented as mean values ± SD (n = 6 Ctl and 8 p107KO biologically independent samples). Two-tailed unpaired Student’s t test for cell number, ***p < 0.001. c Cell cycle analysis by flow cytometry for Ctl, p107KO and Sirt1KO c2MPs. Data are presented as mean values ± SD (n = 8 Ctl and 9 p107KO, and 8 Ctl and 13 Sirt1KO biologically independent samples). Two-tailed unpaired Student’s t test; Ctl and p107KO, *p = 0.0154 G2, ***p < 0.001 G1, S, and Ctl and Sirt1KO **p = 0.0021 G1, 0.0012 G2 ***p < 0.001 S. d Representative Western blot of cytoplasmic (Cyto) and mitochondria (Mito) fractions of p107KO c2MPs that were transfected with empty vector alone or with full length p107 (p107fl) or mitochondria localized p107 (p107mls). e Cell cycle analysis by flow cytometry for cells treated as in (d) (n = 8 vector, 9 p107fl and 9 p107mls biologically independent samples) and (f) cells grown in 5.5 or 25 mM glucose (Glu) in stripped media (n = 6 biologically independent samples). Two-tailed unpaired Student’s t test, ***p < 0.001. g Live cell metabolic analysis of Ctl and p107KO c2MPs for ATP production rate from mitochondria (Mito) and glycolysis (Glyc) and energetic map for ATP rate. Data are presented as mean values ± SD (n = 4 Ctl and 5 p107KO biologically independent samples). Two-tailed unpaired Student’s t test, *p = 0.0390, **p = 0.0032. h RT-qPCR of Nd2, Nd6, Cox2, and Atp6 for Ctl and p107KO c2MPs in the presence or absence of 2.5 mM oxamate (ox). Data are presented as mean values ± SD (n = 4 biologically independent samples). Two-way Anova with post hoc Tukey Nd2 **p = 0.0027 (Ctl ox), ***p < 0.001 (p107KO), (p107KO ox); Nd6 p = 0.0573 (Ctl ox), ***p < 0.001 (p107KO), (p107KO ox); Cox2 ***p < 0.001 (Ctl ox), (p107KO) (p107KO ox), and Atp6 ***p < 0.001 (Ctl ox), *p = 0.0478 (p107KO), p = 0.0595 (p107KO ox). i Live cell metabolic analysis of c2MPs untreated (unt) or treated with ox for ATP production rate, from Mito and Glyc and energetic map. Data are presented as mean values ± SD (n = 11 unt and 8 ox biologically independent samples). Two-tailed unpaired Student’s t test, ***p < 0.001. j Growth curve, (k) proliferation rate, and (l) Cell cycle analysis, for Ctl and p107KO c2MPs untreated or treated with ox. Data are presented as mean values ± SD (n = 6 Ctl, Ctl ox and 8 p107KO, p107KO ox biologically independent samples). Two-way Anova with post hoc Tukey***p < 0.001, ns (non-significant). For detailed statistics see Supplementary Table 3. m Live cell metabolic analysis of p107KO c2MPs untreated or treated with metformin (met) for ATP production rate from Mito and Glyc and energetic map for ATP rate. Data are presented as mean values ± SD (n = 12 unt and 13 met treated biologically independent samples). Two-tailed unpaired Student’s t test, ***p < 0.001. n Growth curve for p107KO c2MPs untreated or treated with met. Data are presented as mean values ± SD (n = 4 biologically independent samples). Two-tailed unpaired Student’s t test, **p = 0.0027 (d1), 0.0037 (d2), ***p < 0.001 (d3). o Time course treatments for Wt and p107KO mice injected with ox, ctx and Brdu and representative confocal immunofluorescence merge of MyoD, Brdu and Dapi (scale bar 20 μm). Arrows denote Brdu and MyoD positive nuclei and p graph depicting the percentage of proliferating MPs from tibialis anterior muscle at day 2 post injury. Data are presented as mean values ± SD (n = 4 for wt, p107KO and n = 5 for Wt ox, p107KO ox independent animals). Two-way Anova with post hoc Tukey, Wt ox **p = 0.0048, ***p < 0.001. Source data are provided as a Source Data file.

