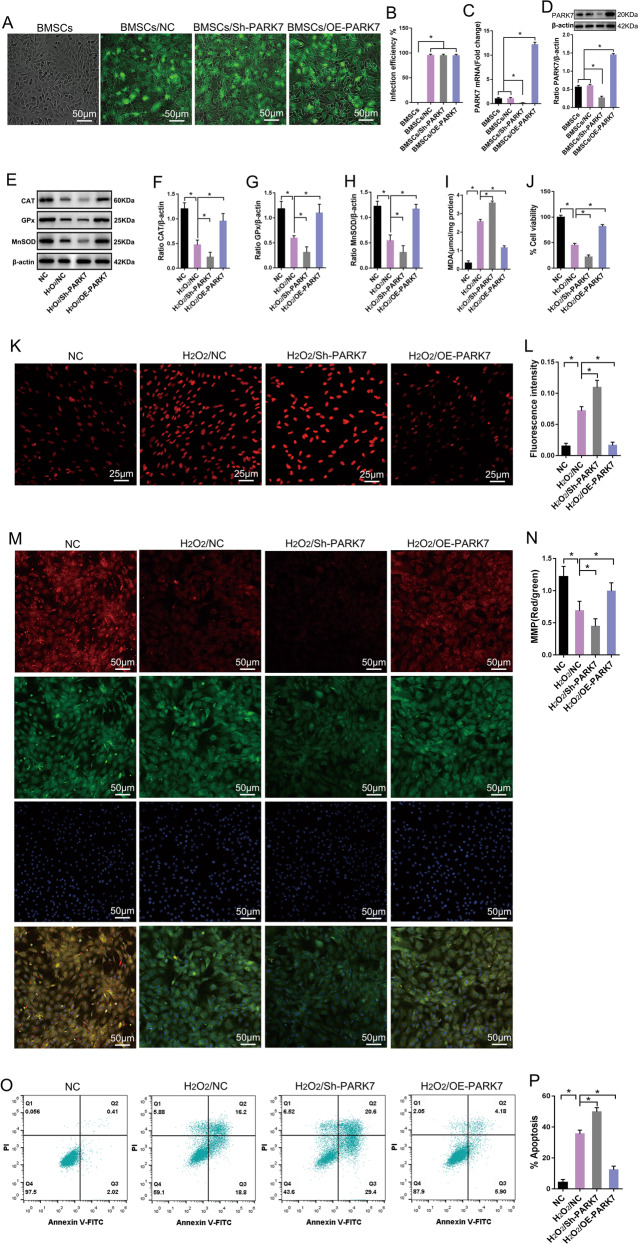
Fig. 1. PARK7 enhances the ability of BMSCs to resist oxidative stress.
After BMSCs were transfected with the PARK7 overexpression or PARK7-interfering lentivirus: A Expression levels of the reporter gene GFP were observed using an inverted fluorescence microscope (n = 6). PARK7 Parkinson disease protein 7, BMSCs bone marrow mesenchymal stem cells, GFP green fluorescent protein, NC negative control, Sh-PARK7 short-hairpin ribonucleic acid of PARK7, OE-PARK7 overexpression of PARK7. B GFP expression levels were quantified in BMSCs as shown in A (n = 6). C RT-qPCR analysis of PARK7 mRNA expression in BMSCs (n = 3). RT-qPCR, real-time quantitative polymerase chain reaction. D Immunoblot analysis of PARK7 expression levels in BMSCs (n = 3). After PARK7 expression was upregulated or downregulated in BMSCs, BMSCs were treated with H2O2 to simulate oxidative stress. E Immunoblot analysis of CAT, GPx, and MnSOD expression in BMSCs (n = 3). MnSOD manganese superoxide dismutase, CAT catalase, GPx glutathione peroxidase, H2O2 hydrogen peroxide. F Quantification of CAT expression is shown in E (n = 3). G Quantification of GPx expression is shown in E (n = 3). H Quantification of MnSOD expression is shown in E (n = 3). I Detection of MDA levels using thiobarbituric acid assay (n = 6). MDA malondialdehyde. J Detection of cell viability using Cell Counting Kit-8 (n = 6). K Detection of ROS levels using DHE (n = 6). ROS reactive oxygen species, DHE dihydroethidium. L Quantification of ROS levels is shown in K (n = 6). M Detection of MMP using a JC-1 assay (n = 5). MMP mitochondrial membrane potential, DAPI 4′,6-diamidino-2-phenylindole; JC-1, 5,5′,6,6′-tetrachloro-1,1′,3,3′-tetraethyl- imidacarbocyanine. N Quantification of MMP is shown in M (n = 5). O Flow cytometry analysis of apoptosis (n = 5). PI propidium iodide, FITC fluorescein isothiocyanate. P Quantification of apoptosis levels is shown in O (n = 6). All data are represented as mean ± standard deviation (SD). *P < 0.05. Differences were tested using one-way analysis of variance (ANOVA) with Tukey’s post hoc test (B–D, F–J, L, N, P).

