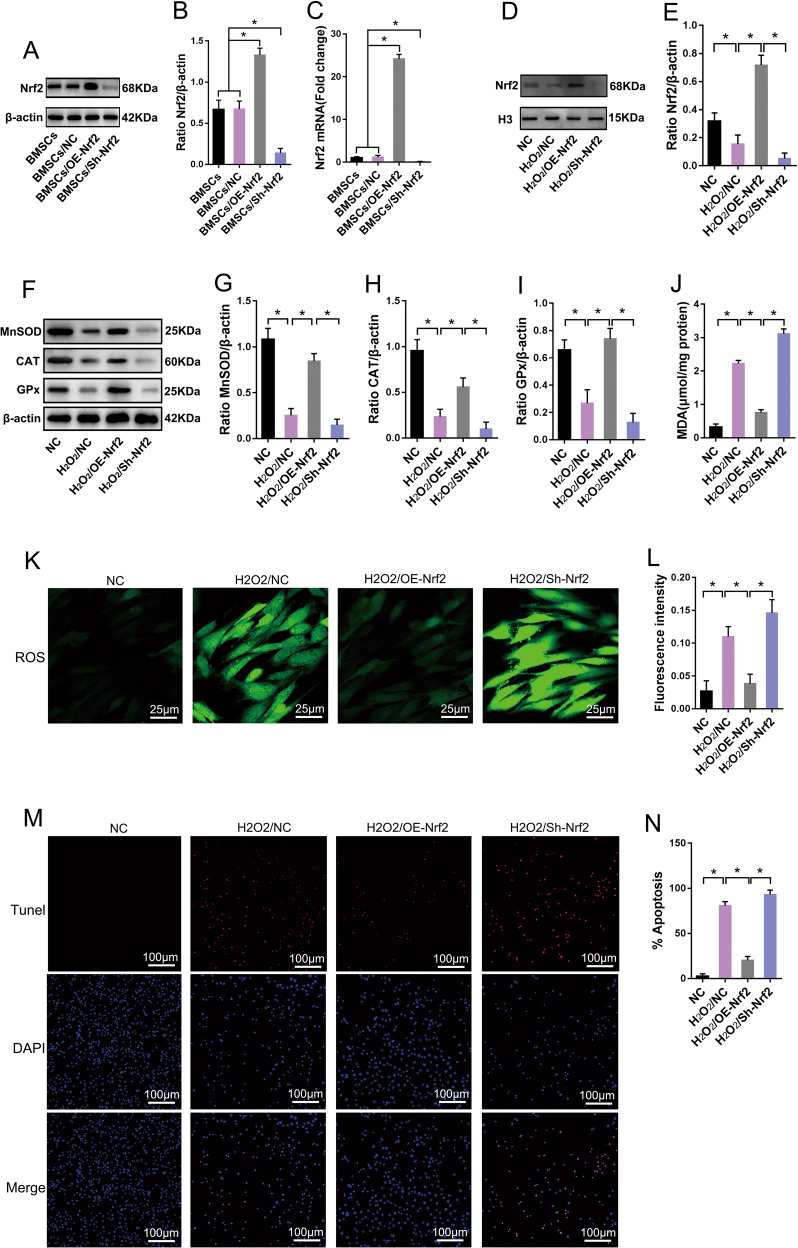
Fig. 2. Nrf2 signaling pathway participates in reversing oxidative stress in BMSCs.
After BMSCs were transfected with the Nrf2 overexpression or Nrf2 interfering lentivirus. A immunoblot analysis of Nrf2 protein expression in BMSCs (n = 3). Nrf2 nuclear factor (erythroid-derived 2)-like 2, Sh-Nrf2 short-hairpin ribonucleic acid of Nrf2, OE-Nrf2 overexpression of Nrf2. B Quantification of Nrf2 expression is shown in A (n = 3). C RT-qPCR analysis of Nrf2 mRNA expression in BMSCs (n = 3). After Nrf2 was upregulated or downregulated in BMSCs, BMSCs were treated with H2O2 to simulate oxidative stress. D Immunoblot analysis of Nrf2 protein expression in BMSC nuclei (n = 3). H3, histone 3. E Quantification of Nrf2 expression is shown in D (n = 3). F Immunoblot analysis of MnSOD, CAT, and GPx protein expression in BMSCs (n = 3). G Quantification of MnSOD expression is shown in F (n = 3). H Quantification of CAT expression is shown in F (n = 3). I Quantification of GPx expression is shown in F (n = 3). J Detection of MDA levels using thiobarbituric acid assay (n = 6). K Detection of ROS levels using DCFH-DA (n = 5). DCFH-DA dichlorodihydrofluorescein diacetate. L Quantification of ROS levels is shown in K (n = 5). M Analysis of apoptosis activity using TUNEL/DAPI staining (n = 5). TUNEL terminal deoxynucleotidyl transferase deoxyuridine-5′-triphosphate nick end labeling. N Quantification of TUNEL-positive signal in BMSCs is shown in M (n = 5). All data are represented as mean ± SD. *P < 0.05. Differences were evaluated using one-way ANOVA with Tukey’s post hoc test (B–C, E, G–J, L, N).

