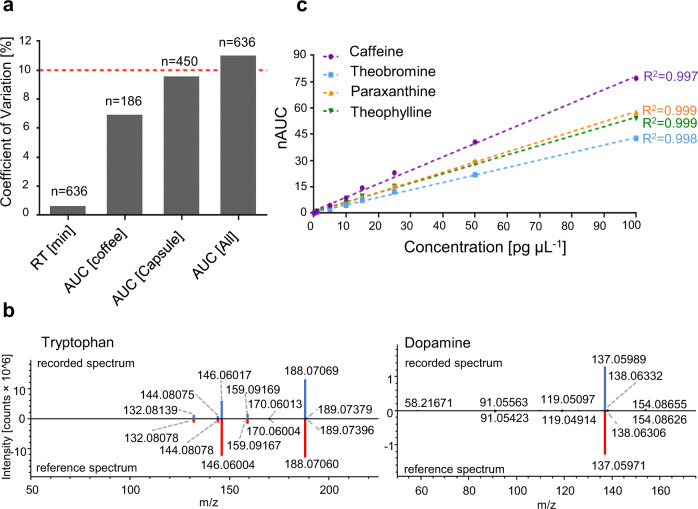
Fig. 2. LC-MS/MS analysis of metabolites from sweat of the fingertips is precise and robust.
a Coefficients of variation of the retention times (RT) and areas under the curve (AUC) of a set of LC-MS/MS runs, as well as AUCs for the coffee (study B) and caffeine capsule (study C.1) intervention studies were determined for the internal standard caffeine-(trimethyl-D9). The means (boxes) and standard deviations are as follows: for the retention time 3.28 ± 0.02, for the coffee AUCs 1.80 ± 0.13 × 10⁶, for the capsule AUCs 1.56 ± 0.15 × 10⁶ and for all AUCs 1.63 ± 0.18 × 10⁶. The dashed red line was set to 10%. b Head-to-tail comparison of the recorded MS2 spectrum (blue) to the reference spectrum from mzcloud (red) of tryptophan (left) and dopamine (right) demonstrates high spectral quality supporting reliable compound identification. c Calibration curves for caffeine, theobromine, paraxanthine and theophylline with respective correlation factors (R2) are shown. nAUC normalised area under the curve.

