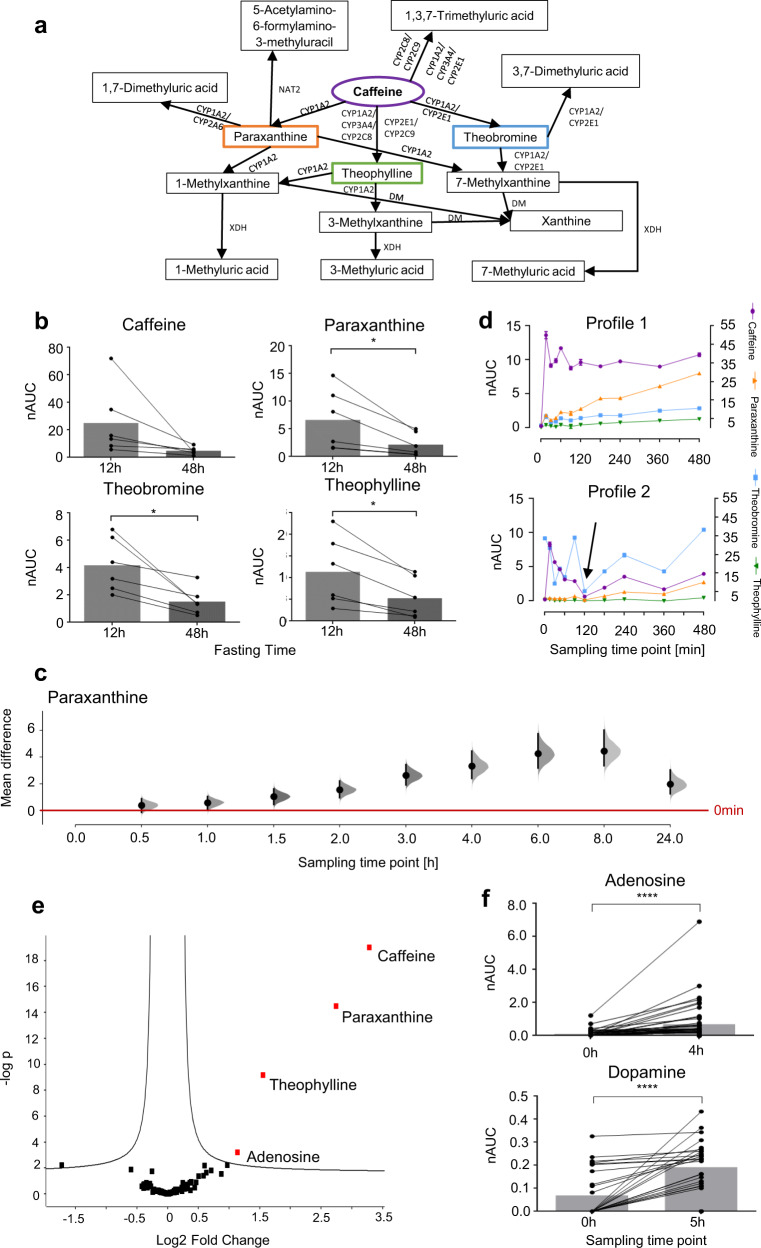
Fig. 4. Consumption of a caffeine capsule enables to elucidate individualised metabolic traits from sweat of the fingertips.
a Caffeine metabolism including known metabolic routes, metabolites and related enzymes: CYP cytochromes P450, NAT2 N-acetyltransferase 2, XDH xanthine dehydrogenase, DM demethylase. These metabolites were all detected in sweat from the fingertips. b Six individuals participated in the coffee as well as in the caffeine capsule studies. The AUCs of caffeine and the primary metabolites are compared depending on the duration of the fasting period (12 vs 48 h, n = 6). Longer fasting significantly reduced the amounts of xenobiotics in sweat from the fingertips. It was tested with Kolmogorov–Smirnov test using Dallal–Wilkinson-Lilliefors p-value if values came from a Gaussian distribution. A two-tailed paired t-test (6 participants × 2 time-points) was performed for caffeine, paraxanthine, theobromine, and theophylline. c Shared-control plot with data from 47 volunteer profiles for paraxanthine is shown. The mean differences between the control group (time-point before consumption, red line) and each of the sampling time-points post ingestion is plotted on the y-axis. Paraxanthine is significantly upregulated from the sampling time-point 1.5 h on after ingesting a caffeine capsule. The effect size is presented as a bootstrap 95% confidence interval. Mean difference, lower and upper limits are provided in the Source data. d Exemplary metabolic profiles of two participants, demonstrating individual differences in metabolic properties regarding caffeine metabolism as exemplified by the preferential formation of paraxanthine in volunteer profile 1 in contrast to theobromine in case of volunteer profile 2. Caffeine is displayed on the right y-axis, while theobromine, paraxanthine and theophylline are displayed on the left y-axis. Error bars represent standard deviation of two technical replicates (n = 2) for each of the 11 time-points. Means and standard deviations can be found in the Source data. e Metabolic changes 4 h after consuming a caffeine capsule demonstrated with a volcano plot illustrating the similarities of metabolite regulations in 47 volunteer profiles. Next to the known caffeine metabolites, adenosine is regulated. f Boxplots for adenosine and dopamine before and 4 h/5 h after consuming a 200 mg caffeine capsule shown for 47 (study C.1 and C.2)/ 27 (study C.2) volunteer profiles. Normality of the data was checked with D’Agostino-Pearson test. A two-tailed Wilcoxon Signed Rank Test was performed for adenosine. A tow-tailed t-test was performed for dopamine. nAUC normalised area under the curve. Boxes represent the means of each time-point. All statistical test results as well as means and standard deviations can be found in the methods section.

