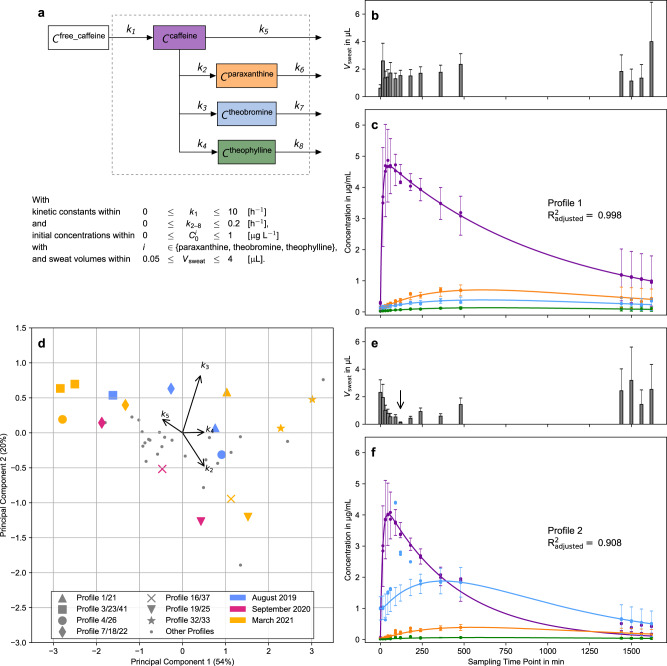
Fig. 5. Metabolic networks facilitate the discovery of dynamic metabolic patterns from individuals.
a Network of caffeine and its major metabolites that was used for fitting of the concentration time-series and the constraints of fitting parameters. b, e Estimated sweat volumes (Vsweat) in µL of the measurements of volunteer profiles 1 and 2, respectively. Each bar represents a single Vsweat. The error bars show the 95% confidence intervals of the model prediction. c, f Fitted concentration time-series of caffeine, paraxanthine, theobromine and theophylline for volunteer profiles 1 and 2 (compare Fig. 4d). The lines refer to the fitted concentration and the symbols refer to the measured values () divided by Vsweat at each time-point (Eq. (1)). The error bars show the 95% confidence intervals of the model prediction (n = 2 technical replicates times 4 metabolites times 15 time-points per profile). The arrow marks the sweat volume of profile 2 at 120 min (see text). A visual representation of the influence of the sweat volume on the fit is shown in Supplementary Fig. 7. d Two-dimensional PCA plot of the fitted caffeine conversion constants. Volunteer profiles (i.e. time-series) from the same participant are plotted with large, coloured symbols whereas participants who contributed only once are marked with small grey circles. The colours represent the month of sampling.

