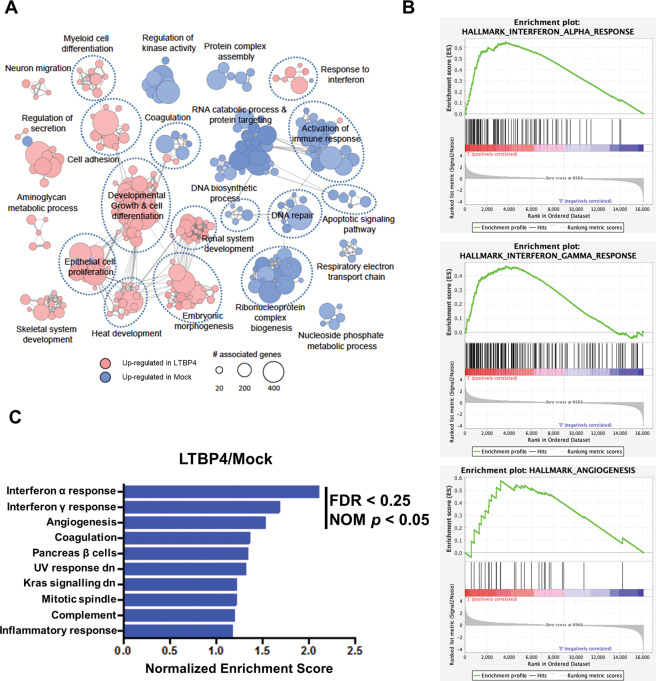
Fig. 3. LTBP4 overexpression enriches differentiation, immune response, and angiogenesis phenotypes in HK-2 cells.
A Enrichment map showing significantly perturbed functions in the LTBP4 overexpression group compared to those in Mock cells based on Gene Ontology gene sets. Edges indicate shared genes. B Gene set enrichment analysis (GSEA) plot for representative gene sets enriched in LTBP4 overexpression vs. Mock cells. C Top 10 biological functions enriched in LTBP4 overexpression vs. Mock cells. FDR: false discovery rate. NOM p: nominal p.

