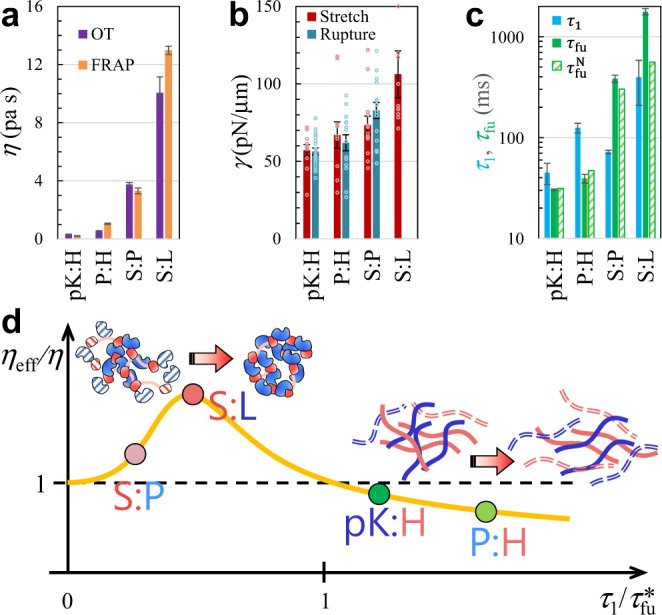
Fig. 4. Deviations of condensates from Newtonian fluids.

a Comparison of zero-shear viscosities from the present OT measurements and deduced from FRAP time constants in our previous study26. Results are presented as fitted value ± standard error of the fit. OT results were determined by fitting the data in Fig. 3a to the Burgers model (Eq. 2a, b). FRAP results were converted from FRAP time constants (Eq. S15 in Supplementary Text); the latter in turn were determined by fitting FRAP time traces (average of triplicate measurements) to an exponential function (Eq. S13 in Supplementary Text). For S:L droplets, the L concentration was 300 μM in the OT measurements but 2000 μM in FRAP; a somewhat higher is thus expected in the FRAP experiment. For pK:H droplets, the equimolar component concentration was 100 μM in the OT measurements but 50 μM in FRAP. b Interfacial tensions from OT measurements, by either stretching (N = 10 to 13) or rupturing (N = 14 to 20) droplets. Dot plots display raw data from replicate measurements; bar graphs display mean ± standard error of the mean. The trap stiffnesses were 450 to 750 pN/μm in the stretching experiments and around 1600 pN/μm in the rupture experiments. Quantification of interfacial tension from rupture force involved an arbitrary scaling constant f (see Eq. 43 in Supplementary Information). For S:L droplets, the rupture force exceeded the trapping power of the instrument and hence only a lower bound of 100 pN/μm could be placed for . c Comparison of shear relaxation time (; this study), measured fusion time (; data were determined here for pK:H and from ref. 26 for the other three types of droplets), and fusion time () predicted by the viscocapillary model. Results for were determined by fitting the data in Fig. 3a to the Burgers model (Eq. 2a, b), and are presented as fitted value ± standard error of the fit. Raw data (N = 4 to 17 droplets with various sizes) were first fit to a linear function of droplet radius (Eq. 3); results in the bar graph represent fitted slope ± standard error of the fit, both multiplied by a fixed = 3 μm. d Shear thickening at < 1 and shear thinning at > 1. The solid curve displays characteristic behaviors of associative polymers. The illustration at the top shows a shear-induced strengthening of macromolecular networks; the illustration on the right shows the opposite effect.
