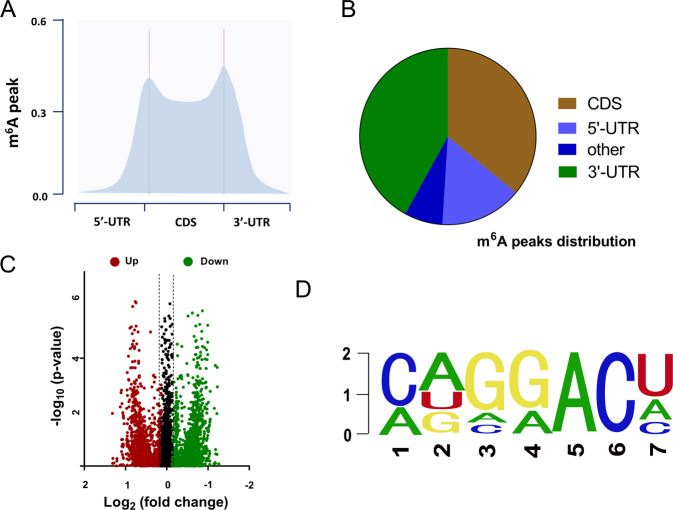
Fig. 1. MeRIP-Seq revealed the m6A profile in the GBM.
A MeRIP-Seq was performed and found that the m6A peaks frequency was mainly located in the 5-end untranslated regions (5ʹ-UTR), coding region (CDS) and 3ʹ-UTR. B Pie chart demonstrated the distribution of m6A peaks in the GBM genome. C Volcano plot displayed the upregulated or downregulated targets labeled with m6A peaks. D The m6A motif with the highest frequency is the GGACU motif.

