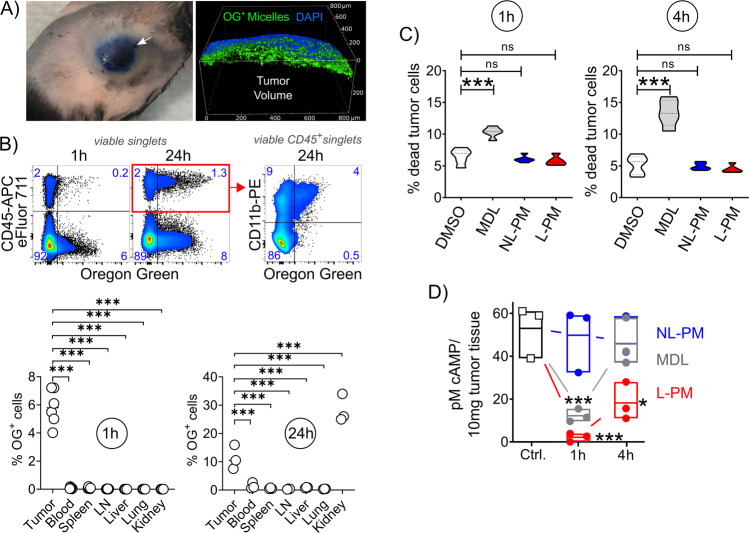
Fig. 2. Effect and distribution of peritumorally injected MDL-loaded polymer micelles.
A Peritumoral injection. Left: Image of a mouse with B16 melanoma after peritumoral injection of Evans Blue, injection site indicated by the arrow, fur removed for better visibility; right: Confocal microscopic image of the tumor margin after peritumoral injection of Oregon Green (OG)-labeled micelles. B Frequency of OG-labeled cells in different organs 1 and 24 h after peritumoral injection of OG-labeled L-PM micelles at day 14 B16-OVA melanomas. Representative flow cytometric plots, numbers represent cell frequencies in gates. LN lymph nodes (n = 6 (1 h) and n = 3 (24 h) per organ, all comparisons ***P < 0.001 (parametric one-way ANOVA, with Holm–Šídák’s multiple comparisons test, alpha = 0.05, 0.95 confidence interval). C Micelles (NL-PM, blue; L-PM, red), free inhibitor (MDL, gray), and solvent (DMSO, white) toxicity in tumor tissue 1 and 4 h after peritumoral injection at day 14 melanomas. Violin plots show median, interquartile range, minimum and maximum (truncated above and below max and min values) of dead CD45negCD29+ tumor cells, n = 5 per treatment, ***P = 0.00099 (1 h) ***P = 0.00099 (4 h) ns = nonsignificant (parametric One-way ANOVA, with Holm–Šídák’s multiple comparisons test, alpha = 0.05, 0.95 confidence interval). D Intracellular cAMP levels in day 14 B16-OVA melanoma tissue after peritumoral injection of 10 µg MDL dissolved in DMSO, L-PM (10 µg MDL) or NL-PM (same amount of particle substance as L-PM). Data shown as mean ± SEM, n = 3 per treatment, *P = 0.006 (NL-PM vs. L-PM, 4 h), ***P = 0.00099 (NL-PM vs. L-PM, 1 h), ***P = 0.00099 (MDL vs. NL-PM, 1 h) (parametric one-way ANOVA, with Holm–Šídák’s multiple comparisons test, alpha = 0.05, 0.95 confidence interval). All figures and graphs are representative of three independent experiments each.

