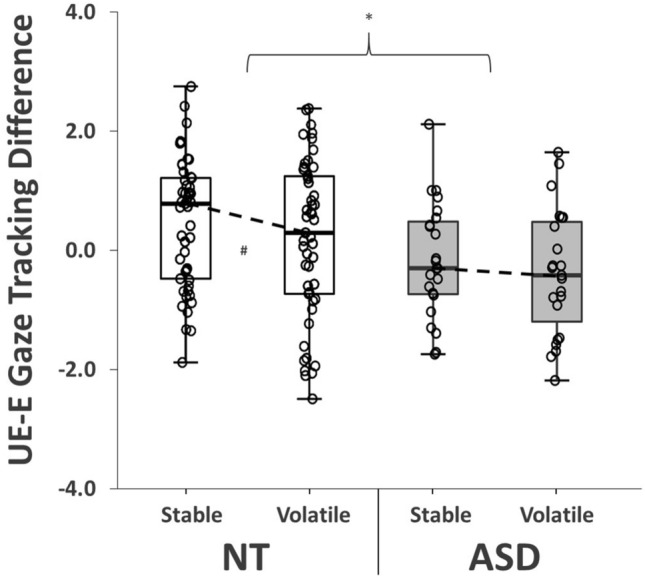
Figure 5.

Gaze Tracking Responses. Group differences in gaze tracking behaviours between expected (E) and unexpected (UE) test trials. Higher index values signify more ‘prediction-driven’ errors in post-bounce gaze pursuit (i.e., greater behavioural surprise when faced with the unexpectedly ‘bouncy’ balls). NT neurotypical, ASD autism spectrum disorder. *denotes significant between-group difference (p < .05); #denotes significant change between conditions (p < .05).
