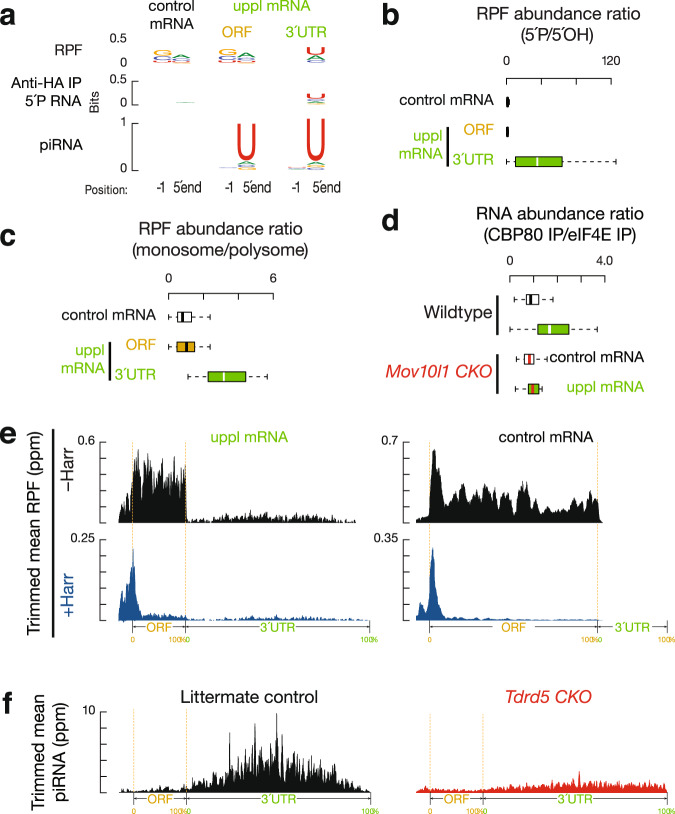
Fig. 4. Biphasic piRNA biogenesis.
a Sequence logos depicting nucleotide (nt) bias at 5′-ends and 1 nt upstream of 5′-ends. Top to bottom: RPF species, anti-HA-immunoprecipitated 5′P RNA species, and piRNAs in adult testes, which map to mRNAs, uppl mRNA ORFs, and 3′UTRs, respectively. b Boxplots of the ratios of 5′P RPF versus 5′OH RPFs in adult wild-type testes. Control mRNA n = 43, uppl mRNA n = 30. c Boxplots of the ratios of RPF abundance in monosome fractions versus those in polysome fractions in adult wild-type testes. Control mRNA n = 43, uppl mRNA n = 30. d Boxplots of the ratios of RNA abundance in CBP80 IP versus eIF4E IP in adult wild-type (upper) and Mov10l1 CKO mutant (lower) testes. Control mRNA n = 43, uppl mRNA n = 30. e Aggregated data for RPF abundance from untreated adult testes (top) and from harringtonine-treated adult testes (bottom) across 5′UTRs, ORFs, and 3′UTRs of the uppl mRNAs (left) and control mRNAs (right). The x-axis shows the median length of these regions, and the y-axis represents the 10% trimmed mean of relative abundance. f piRNA abundance on uppl mRNAs (10% trimmed mean) in adult testes. Control (left) and Tdrd5 CKO (right). Box plots in (b–d) show the 25th and 75th percentiles, whiskers represent the 5th and 95th percentiles, and midlines show median values.

