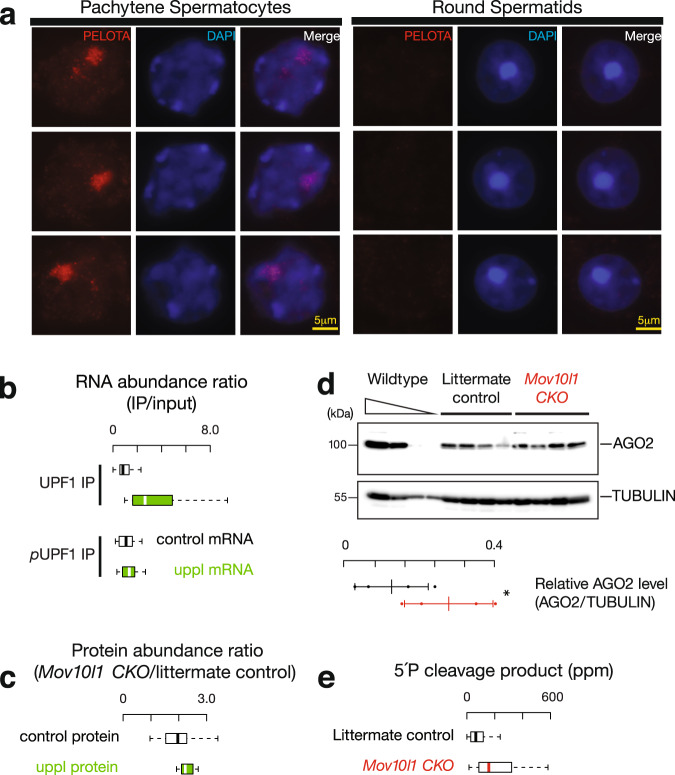
Fig. 5. 3′UTR piRNA biogenesis as a special co-translational mRNA decay pathway.
a Immunolabeling of squashed pachytene spermatocytes (left) and round spermatids (right). Three examples of each stage were shown using anti-PELOTA, DAPI, and merged. Experiments were repeated at least three times independently with similar results. Scale bar, 5 μm. b Boxplots of the ratios of RNA abundance in UPF1 IP (upper) and phosphorylated UPF1 IP mutant (lower) versus their corresponding input in adult wild-type testes. Control mRNA n = 43, uppl mRNA n = 30. c Boxplots of the changes of protein abundance coded per gene in Mov10l1 mutants (sample size n = 5 independent biological replicates) compared to littermate controls in adult testes. Control mRNA n = 43, uppl mRNA n = 30. d AGO2 western blot (top) and TUBULIN western blot (bottom) of adult testis lysates from serial dilutions of adult wild-type lysates (left) and four biological replicates of Mov10l1CKO/∆ Neurog3-cre (middle) and Mov10l1CKO/∆ (right). Abundance of AGO2 and TUBULIN was quantified using ImageJ158 and then fitted to the standard curve of the wild-type testis lysates. Relative abundance of AGO2 were calculated as the abundance of AGO2 normalized by the abundance of TUBULIN (sample size n = 4 independent biological samples). Data are mean ± standard deviation; *p = 0.048, one-side Student’s t test. Each data point was overlaid as dot plots. e Boxplots of the 5′P decay intermediates per mRNA in adult wild-type testes. AGO2 target transcripts n = 41. Box plots in (b, c, e) show the 25th and 75th percentiles, whiskers represent the 5th and 95th percentiles, and midlines show median values.

