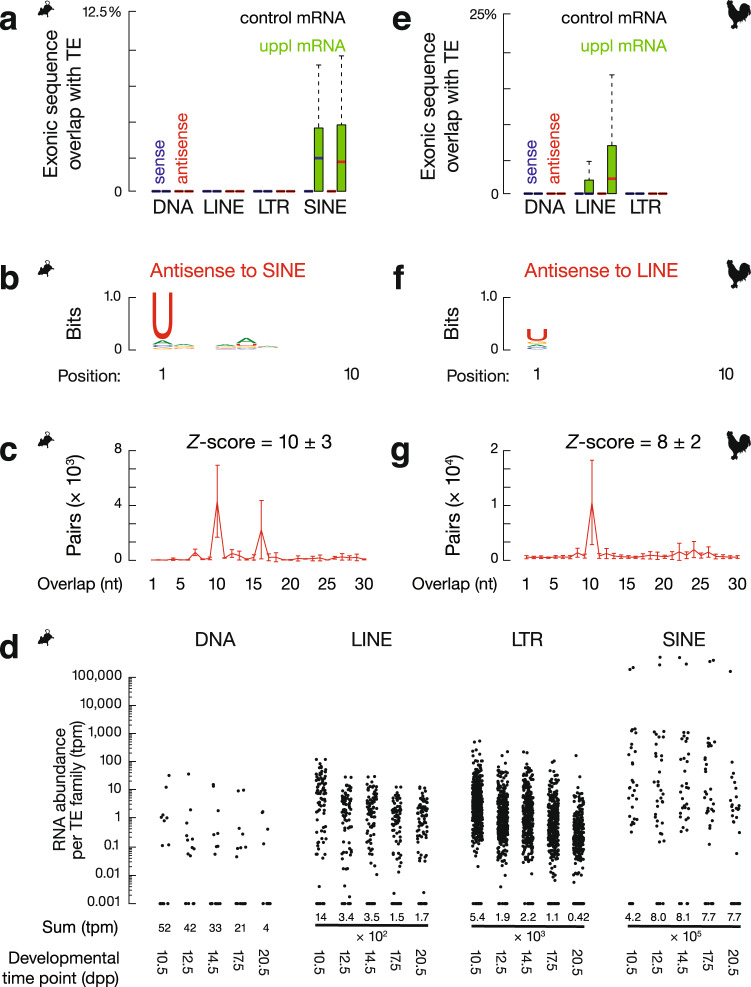
Fig. 7. Spliced piRNA precursor mRNAs contain transposon fragments.
a Boxplots showing the fraction of transcript exon sequence correspondence to sense (blue) and antisense (red) transposon sequences in mouse genome. Control mRNA n = 43, uppl mRNA n = 30. b Sequence logo showing the nucleotide composition of antisense SINE-piRNA species that uniquely map to mouse uppl mRNAs. c The 5′–5′ overlap between piRNAs from opposite strands of SINE consensus sequences was analyzed to determine whether antisense SINE piRNAs from mouse uppl mRNAs display Ping-Pong amplification in trans. The number of pairs of piRNA reads at each position is reported (sample size n = 3 independent biological replicates). Data are mean ± standard deviation. The Z score indicates that a significant ten-nucleotide overlap (Ping-Pong) was detected. Z score = 1.96 corresponds to p value = 0.025. d The RNA abundance of each TE superfamily in testes at the five developmental time points. Dpp: days postpartum, tpm: transcript per million. e Boxplots showing the fraction of transcript exon sequence correspondence to sense (blue) and antisense (red) transposon sequences in chicken genome. Control mRNA n = 23, uppl mRNA n = 23. f Sequence logo showing the nucleotide composition of antisense LINE-piRNA species that uniquely map to chicken uppl mRNAs. g The 5′–5′ overlap between piRNAs from opposite strands of LINE consensus sequences was analyzed to determine whether antisense LINE-piRNAs from chicken uppl mRNAs display Ping-Pong amplification in trans (sample size n = 3 independent biological replicates). Data are mean ± standard deviation. Z score = 1.96 corresponds to p value = 0.025. Box plots in a, e show the 25th and 75th percentiles, whiskers represent the 5th and 95th percentiles, and midlines show median values.

