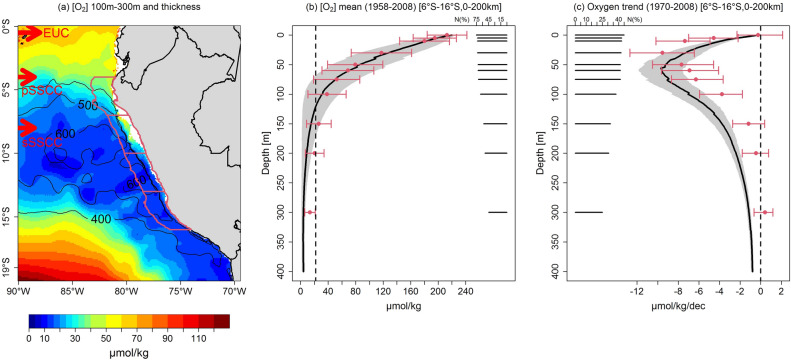
Figure 1.
Dissolved oxygen mean state and trends off Peru. (a) Mean observed DO concentration (in µmol kg−1; color shading) and OMZ thickness (in meters; black contours); (b) mean observed (red dots) and modeled (black line) DO (in µmol kg−1) in a coastal band of 200 km, between 6° and 16° S; (c) DO linear trend (in µmol kg−1 dec−1) computed over 1970–2008 from IMARPE data (red dots) and model output (black line) at different depth levels. Black horizontal bars indicate the percentage of months with observations with respect to the total number of months (468) in the 1970–2008 period for each depth (right side of (b) and left side of (c)). Red bars and grey shading in (b) and (c) indicate error bars for the observed and model values, respectively. The figures were generated using the software R (R Core Team, version 4.1.1., http://www.R-project.org/).

