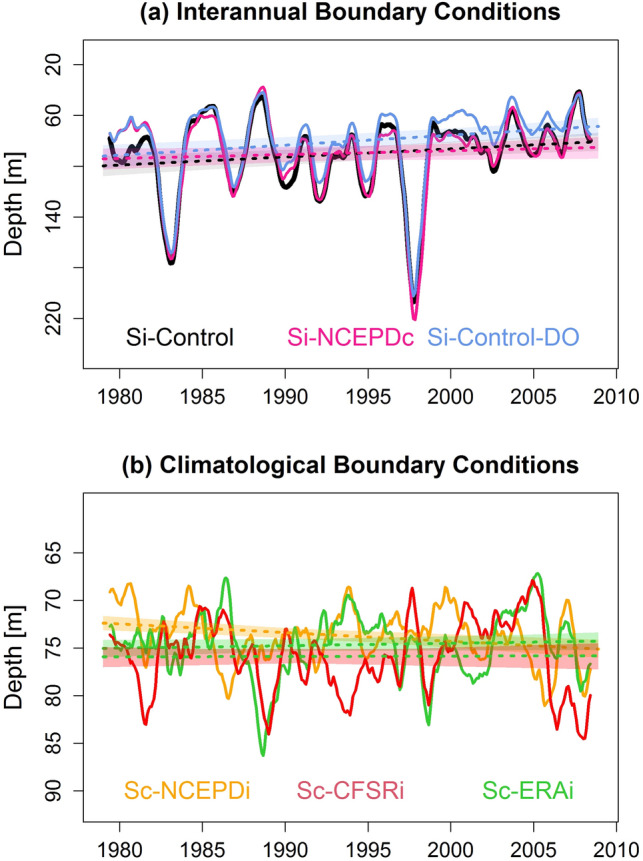
Figure 3.

Oxycline response to remote and local forcing. Temporal evolution of modeled oxycline depth for the model experiments described in Table 1. Model simulations are either forced by interannual boundary conditions (Si-Control (black line), Si-NCEPDc (cyan line), Si-Control-DO (blue line), or by climatological boundary conditions and interannual wind forcing (Sc-NCEPDi (yellow line), Sc-CFSRi (red line), Sc-ERAi (green, line). Note the change of scale in the vertical axis in (a) and (b) marking the weaker trends in (b). The figures were generated using the software R (R Core Team, version 4.1.1., http://www.R-project.org/).
