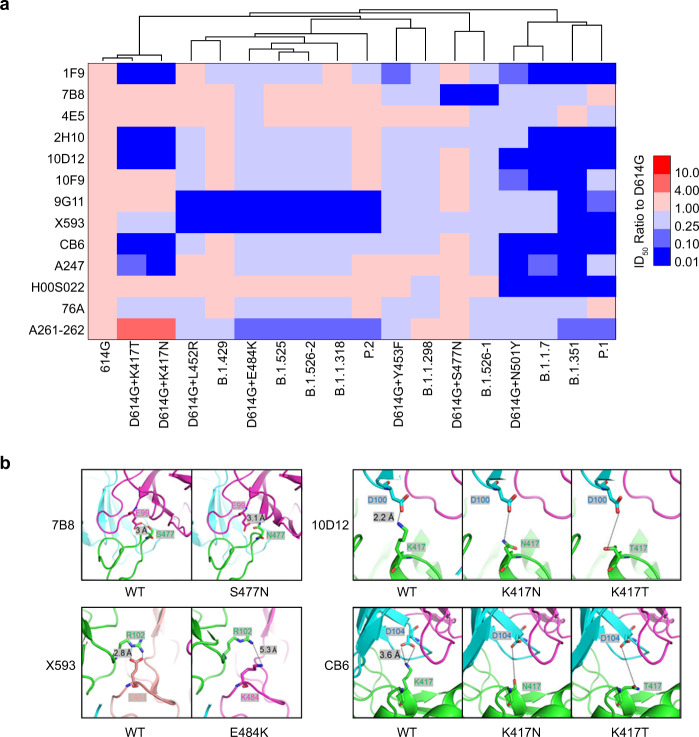
Fig. 4. Neutralization analyses of mAbs.
a Thirteen mAbs were diluted serially and pre-incubated with pseudotyped SARS-CoV-2 variants at 37 °C for 1 h, then added to Huh-7 cell cultures. The heat map shows of mean ID50 ratio compared with D614G. The results were obtained from three independent experiments. Red indicates increased neutralization activity and blue indicates decreased neutralization activity, as shown in the scale bar. b Structural modelling of the K417N/T, L452R, Y453F, S477N, E484K and N501Y mutations, based on 7chh for X593, RBD-7B8 for 7B8, RBD-Ab1 for 10D 12, and 7c01 for CB6.

