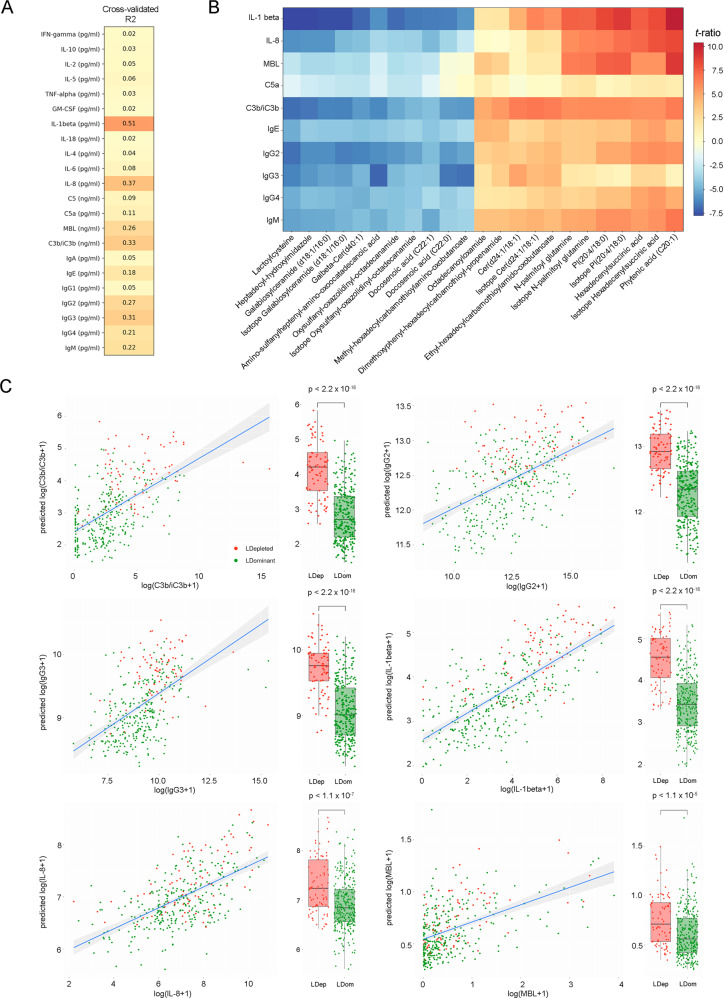
Fig. 4. Assessment of host response at the mucosal interface using direct on-swab DESI-MS profiling.
A Cross-validated R2 value for all 22 corresponding measured immune mediator concentrations. B Heatmap of top 23 significantly correlated metabolite features with top 10 immune mediators (IL-1β, IL-8, MBL, C5, C3b/C3bi, IgE, IgG2, IgG3, IgG4, IgM). t-ratio ranges from +10 (red) to −7.5 (blue). C Association between predicted log-transformed value of immune marker by DESI-MS and measured log-transformed values by multiplexed immune-assay for IL-1β (CV R2 = 0.51), IL-8 (CV R2 = 0.37), C3b/iC3b (CV R2 = 0.33), IgG3 (R2 = 0.31), IgG2 (CV R2 = 0.27), MBL (CV R2 = 0.26). A linear regression line was fitted to the log-transformed values and their corresponding prediction. A box plot of predicted immune marker levels for LDEP (red) and LDOM (green) samples is also presented (n = 136 pregnancies, 369 swabs). The lower, interior horizontal line, and upper bounds of the box represent the 25th, median and 75th percentile values, respectively. Whiskers are drawn from the corresponding box boundary to the most extreme data point located within the box bound ± 1.5 × IQR (interquartile range). P values are reported for a two-tailed Welch t-test for the difference in mean predicted immune markers between LDEP and LDOM.

