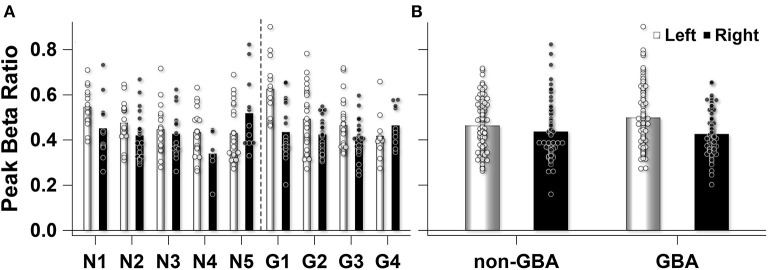
Figure 5.
(A) Observed peak beta ratio for each participant in the non-GBA (N) and GBA (G) group. The unfilled (left STN) and filled (right STN) bars show the mean peak beta ratio for each participant. The unfilled (left STN) and filled (right STN) circles represent the peak beta ratio for each 5s epoch that contributed to the mean for each participant. (B) The mean peak beta ratio for the non-GBA (n = 5) and GBA (n = 4) participants. Unfilled bars and circles represent left STN mean and individual 5s epochs that contributed to the mean, while the filled bars and circles represent the right STN.

