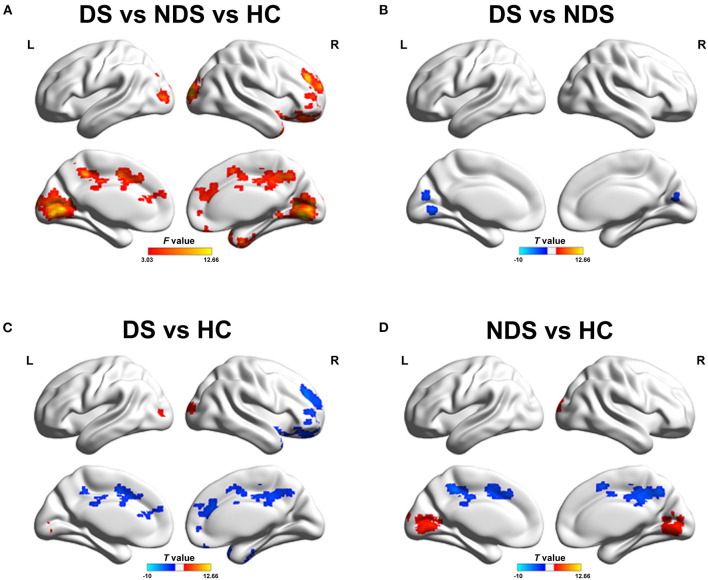
Figure 1.
(A) Group comparisons of FC in left NAcc network among DS, NDS, and HC. The red regions represent significantly different regions. (B) Group analyses of the FC in left NAcc network between DS and NDS. The blue areas denote the regions where DS had lower FC compared to NDS. (C,D) Group analyses of the FC in left NAcc network between patients and HC groups. The blue areas indicate the regions where patients had lower FC compared to HC; the red areas signify the regions where patients had greater FC compared to HC. The significant threshold was set at p ≤ 0.05 after 3dClustSim corrected (voxel p ≤ 0.05, cluster size ≥ 200). FC, Functional Connectivity; NAcc, Nucleus accumbens; DS, Deficit Schizophrenia; NDS, Non-deficit Schizophrenia; HC, Healthy Controls.

