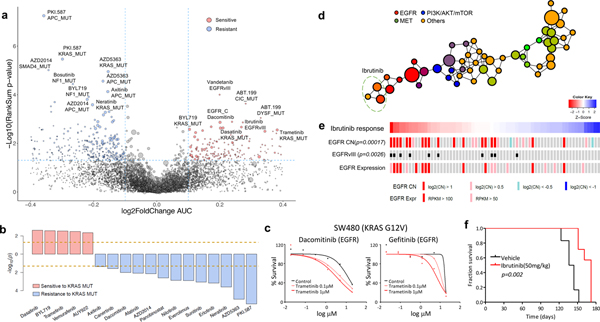
Figure 3. Pharmacogenomic interactions in PDCs.
(a) A volcano plot representation of correlation analysis showing the magnitude and significance of gene-drug associations (n=360 biologically independent samples). (b) Waterfall plot enumerating significant associations between KRAS mutation and drug sensitivity (n=360 biologically independent samples). Two horizontal dashed lines indicate statistical significance. (c) SW480 was treated with DMSO (control) or trametinib (0.1 or 1 mM), followed by incubation with two EGFR inhibitors, dacomitinib (left) and gefitinib (right). Cell viability for each dose was normalized to DMSO or trametinib (0.1 or 1 mM) treatment only cells. (d) Probability distribution of drug-target families over the topological network. Each node represents a set of drugs with similar AUC profiles. A drug can appear in several nodes, and two nodes are connected by an edge if they have at least one drug in common. Colors of the nodes correspond to mean RGB values of drug families. Ibrutinib belongs to three nodes on the network encompassed with an oval. (e) Drug sensitivities to ibrutinib in 67 PDCs. The red color in the heat map represents sensitivity, while the blue color indicates resistance. EGFR alterations including genomic amplification, vIII, and expression are shown. (f) Kaplan-Meier survival plots for P2.T (EGFR amp/vIII) orthotopic mice model. Once intracranial model was established, Vehicle (0.5% methylcellulose) or iburitnib (50mg/kg/day) was administrated orally (PO) for 5 consecutive days and 2 days of resting period per each cycle (n=8 per group). P-values: a,b,e, two-sided wilcox rank sum test. P-values: f, two-sided Log-rank test.

