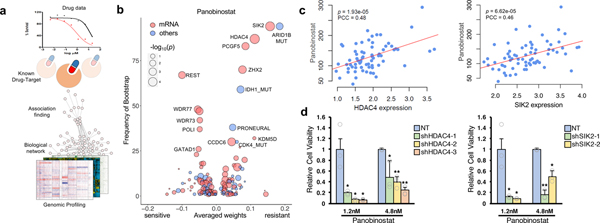
Figure 4. Genomic and transcriptomic correlates of panobinostat sensitivity.
(a) Schematic overview for dNetFS (Diffusion kernel based Network method for Feature Selection of drug sensitivity). In brief, dNetFS integrates genomic/pharmaceutical data, protein-protein interaction network, and prior knowledge of drug-targets interaction to prioritize genetic and gene expression features of PDCs that predict drug response. (b) Predictive features of panobinostat response identified by the dNetFS are plotted for their frequency and effect size. Associations are colored in red for expression features and blue for others. Node size is proportional to the single drug–feature linear correlation. (c) Scatter plot showing linear correlation between panobinostat AUC and HDAC4 expression (left panel) and SIK2 expression (right panel) (n=69 biologically independent samples). The correlation coefficient and the P values were obtained using pearson correlation test. (d) Drug response assessment of panobinostat (1.2nM or 4.8nM) with shRNA-mediated knockdown of HDAC4 or NT (non-target) (left panel) and SIK2 or NT (right panel). Cell viability for each dose was normalized to sole transduced cells only. Data are mean ± s.d. of n=3 technical replicates. Experiments were repeated three times with similar results. *P ≤ 0.05, **P ≤ 0.01, ***P ≤ 0.001, two-tailed t-test.

