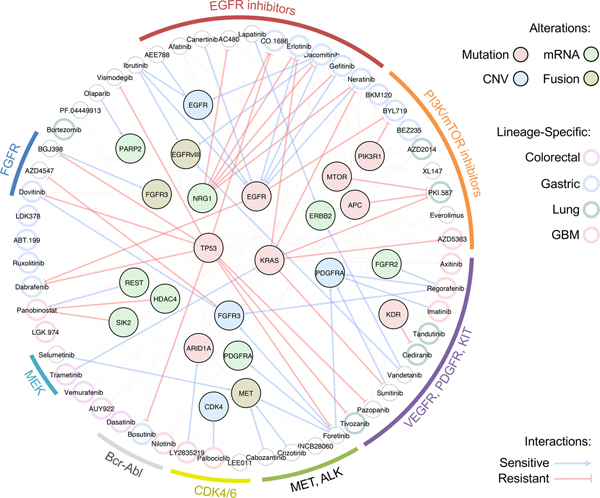
Figure 7. Schematic illustration of major lineage-specific and genomic associated drug interactions.
Molecular targeting agents are clustered based on drug family classification and connected to various genomic alterations including mutation, mRNA expression, copy number variation (CNV), and fusion. Edges represent sensitive or resistant gene-drug interactions. Lineage-specific drug associations are highlighted in each drug node based on specific lineage type.

