Figure 2.

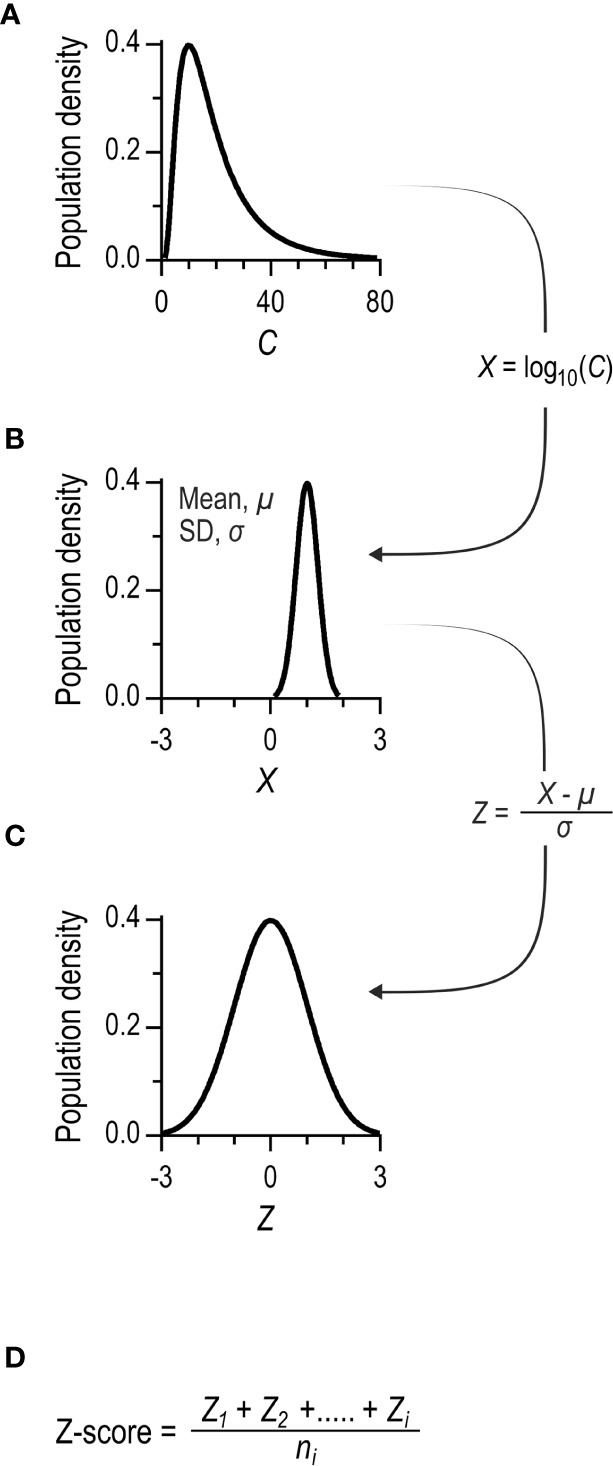
Principles for calculating Z-scores. (A) The distribution of serum concentrations of a serotype-specific antibody in a population. The distribution is typically left-skewed. (B) Log10 transformation of data results in Gaussian distribution. (C) The individual concentrations are further transformed to standard normal distributions. This is achieved by subtracting the mean and dividing by the standard deviation of the population dataset. The final parameter is dimensionless, and the population data set has a mean of 0 and a standard deviation of 1. (D) The Z-score is calculated for each patient as the mean of the standard normal deviations of the individual antibody levels. The Z-score´s standard deviation tends to decrease with an increasing number of distinct serotype-specific antibody levels, owing to mutual correlations (10). To promote comparability of cohorts tested with different number of measured serotype-specific antibody levels, the Z-score is normalized by the standard deviation of the population dataset.
