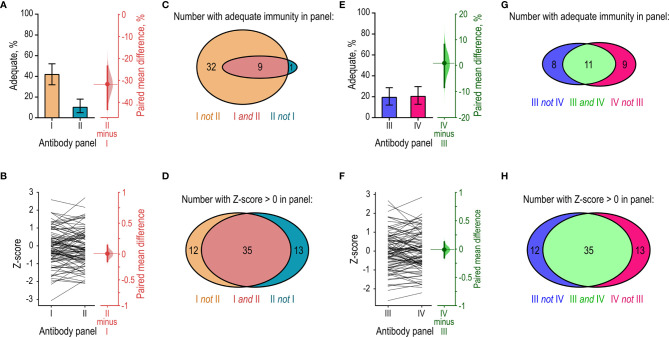
Figure 5.
Sensitivity-analysis of interpretation using the AAAAI guidelines and Z-scores. The same cohort of patients (n = 98) were assessed for adequate immunity after PPV vaccination using different panels of serotype-specific antibodies for the interpretation. Each panel contained six out of the 12 quantified serotype-specific antibodies. (A) Left: The proportions of patients considered to have achieved ‘adequate immunity’ in each of two antibody panels (I and II) according to the AAAAI guidelines. Right: The paired mean difference in proportions (dot) with 95% confidence interval (vertical error lines) and bootstrap sampling distribution (normalized histogram). Panel I contained the six serotype-specific antibodies that most frequently had levels of 1.3 mg/L or higher in the patients. Panel II contained the six serotype-specific antibodies that least frequently had levels of 1.3 mg/L or higher in the patients. (B) Left: Paired Z-scores for the individual patients calculated using data from panel I and panel II. Right: The paired mean difference in Z-score from the two panels. (C) Venn-diagram showing the number of patients with adequate immunity in panels I and II under AAAAI guidelines. Panels I and II identified an unequal numbers of the patients, and the results showed little overlap. (D) As in (C), but for Z-scores. Panels I and II now identified comparable numbers of the patients, and the results largely overlapped. (E) As in (A), but for two other panels (III and IV). These panels were composed to provide an equal proportion of patients with ‘adequate immunity’ under AAAAI guidelines. (F) Comparison of the Z-scores calculated for the patients using the data from panels III and IV. (G) Venn-diagram showing the number of patients with adequate immunity in panels III and IV according to the AAAAI guidelines. Panels III and IV identified comparable numbers of the patients, but the results showed little overlap. (H) As in (G), but for Z-scores. Panels III and IV identified comparable numbers of the patients, and the results largely overlapped.

