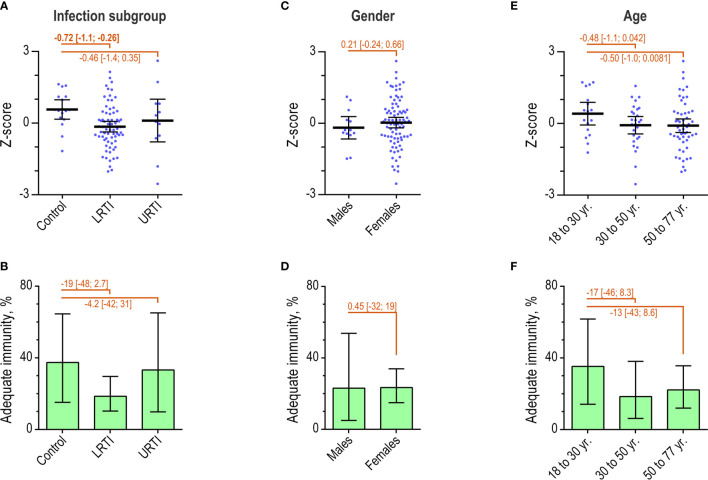
Figure 7.
Immunity after PPV in patient subgroups. (A) Individual Z-scores and mean with 95% confidence interval for patients (n = 98) by infection profiles. Differences between groups were determined as indicated. (B) The percentage of patients with ‘adequate’ immunity according to the AAAAI guidelines, by infection profiles. Error bars are 95% confidence intervals. (C) As in A, but for patients by gender. (D) As in B, but for patients by gender. (E) Individual Z-scores for patients by age intervals. (F) As in B, but for patients by age group.

