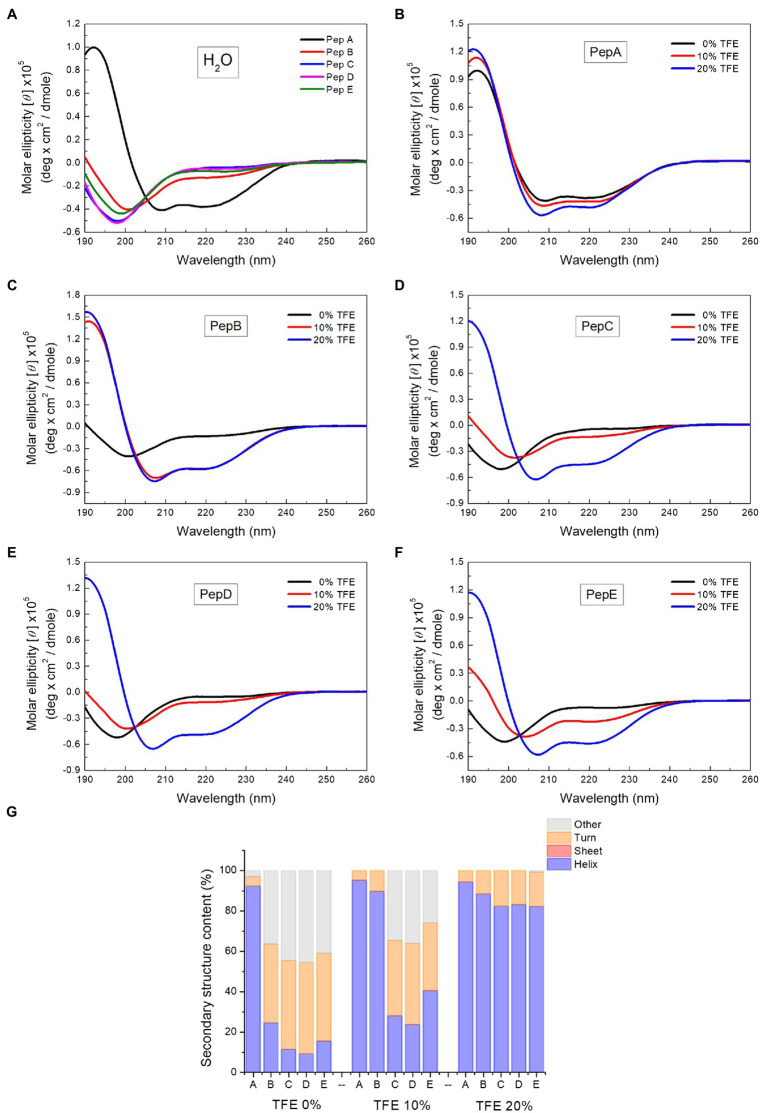
Figure 2.
Circular dichroism (CD) spectra of the peptides and the spectrum deconvolution results. (A) CD spectra of pepA, pepB, pepC, pepD, and pepE in water. (B–F) CD spectra of the peptides in water, 10% trifluoroethanol (TFE), and 20% TFE. (G) Secondary structure content of the peptides in water, 10% TFE, and 20% TFE.

